Humanitarian Engineering for Energy for Displacement (HEED)
1 User Guide
This is the HEED-RER tool user guide. It is designed to provide an accessible step-wise explanation for users on how to navigate the Excel Tool spreadsheet.
https://github.com/heedproject/rert Version 1.2
Developed by: Rembrandt Koppelaar (Scene Connect) Reviewed by: Jonathan Nixon (Coventry University)
1.1 Tool use background
The Humanitarian Engineering and Energy for Displacement (HEED) project aims to understand the energy needs of forcibly displaced people to increase access to safe, sustainable and affordable energy.
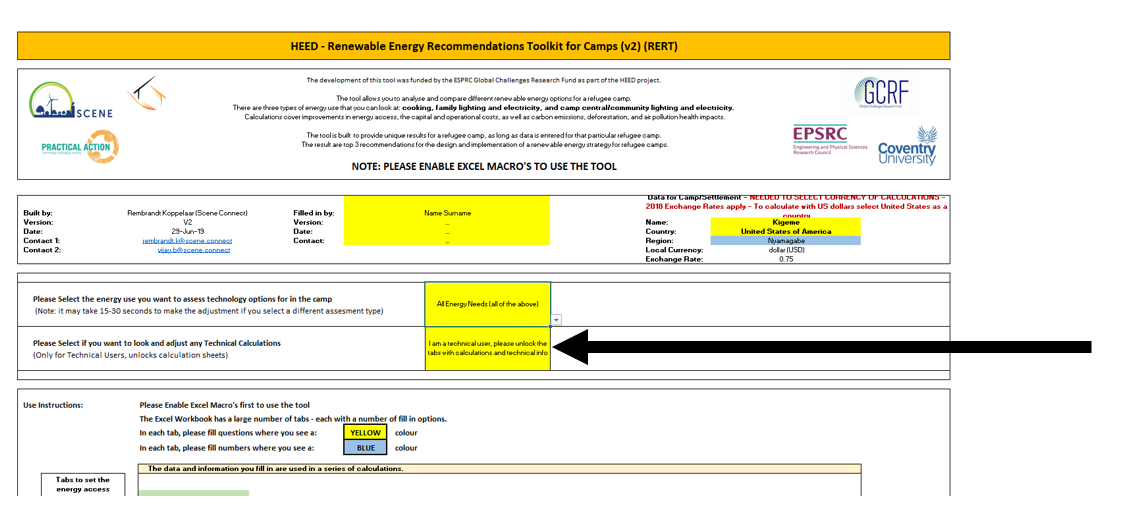
The HEED Renewable Energy Recommendations tool (HEED-RERT) for Camps:
The first version (v1) of the tool was built by Scene Connect with support from Coventry University and Practical Action between June 2018 and August 2019.
It aims to provide technology recommendations based on energy-economic-environment-health performance indicators to provide support for how best to increase energy access in refugee camps and improve sustainability for i) Cooking Energy, ii) Household Lighting and Electricity, iii) Community/Camp central Lighting and Electricity.
Users engage with an Excel spreadsheet where they answer questions to describe the population of the camp, as well as the camp energy infrastructure and energy use of families therein. They can also enter technical data for particular renewable energy and cooking options. This allows the user to localise the results into the local context as much as possible.
Results are presented in the form of an indicator dashboard where different technology options can be compared with their performance indicator scoring.
It is recommended for each camp (or part of a camp) to save the spreadsheet with a new name as its own self-contained version. To this end information can be filled in on the overview tab in the sheet.
The tool has been built with Excel 2018 and Excel 2019 versions. It is not backwards compatible with older versions at this time. Please use recent versions of Microsoft Excel to use it.
Feel free to modify and adjust the tool for your own purposes. HEED-RERT is built on Open Source principles
1.2 Five Steps in HEED-RER Tool Usage
1.2.1 Cooking Stove & Fuel Combinations currently comparable
1.2.2 Household Lighting & Electricity options currently comparable in RERT v1
1.2.3 Camp community / infrastructure energy currently comparable in RERT v1
1.2.4 Dashboard Result: Energy Technologies Compared on Indicators
1.2.5 The Tool Identifies the Top 3 Best Scoring Options
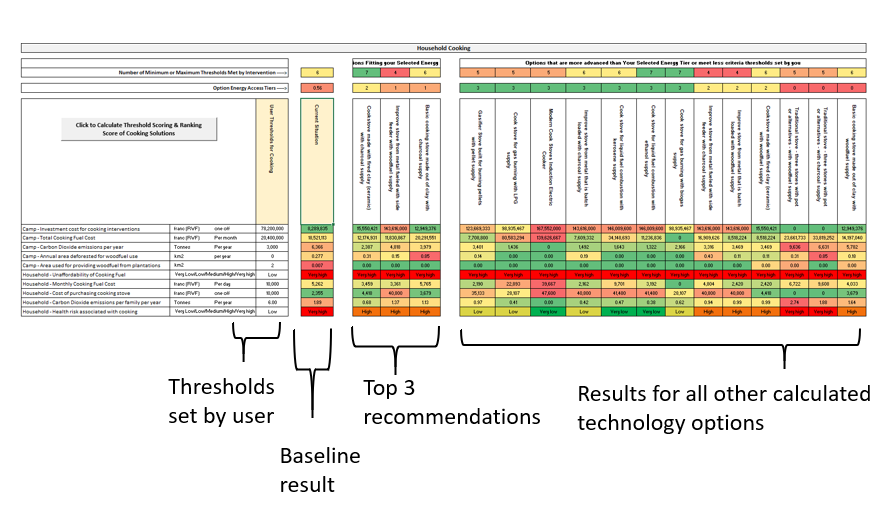
Note: The top 3 recommended options are not ranked or presented in any particular order, they are the three best performing options in relation to the scenario thresholds set by the user.
1.3 Using the tool
1.3.1 Step 1 – Opening the Spreadsheet
You need to enable “macro’s” when opening the spreadsheet when prompted otherwise the results cannot be calculated.

For Help about this see the Microsoft Office Documentation here:
https://support.office.com/en-us/article/enable-or-disable-macros-in-office-files-12b036fd-d140-4e74-b45e-16fed1a7e5c6
1.3.2 Step 2 – Fill in Overview – START HERE - tab

Fill this in to keep track of saved versions
Fill this in with country, camp name and which currency to use in the calculations
Select if you want to look only at i) cooking energy use, ii) at household electricity and lighting, iii) community/central lighting & electricity, or iv) all three of these
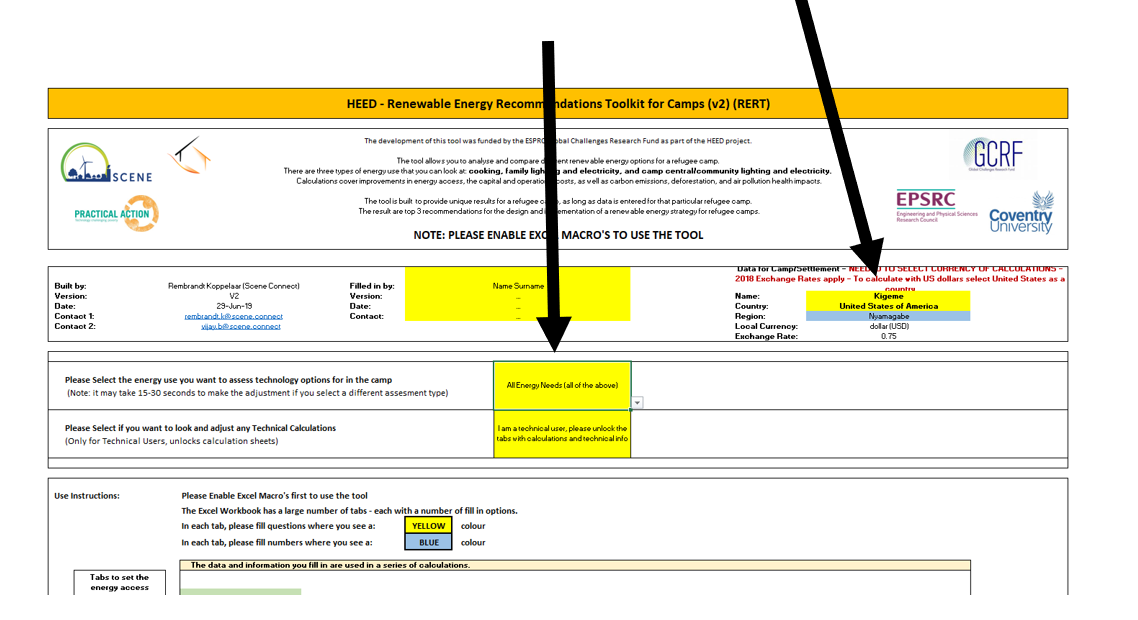
1.3.3 Step 3 – Select Tool Modes
Select here if you are a technical user or a regular user. If you select the technical user option additional spreadsheet tabs will be unlocked and made visible:
Calc_Energy_Demand – containing energy demand calculations
Calc_Energy_Supply – containing demand-supply matching calculations
Calculation_KPIs – containing the calculations for performance indicators
1.3.4 Step 4 - Guide to Provide Camp Information – where
To create an accurate baseline of the energy situation in the Entire Camp, you need to answer close to 100 questions. These are divided in five main areas (spreadsheet tabs):

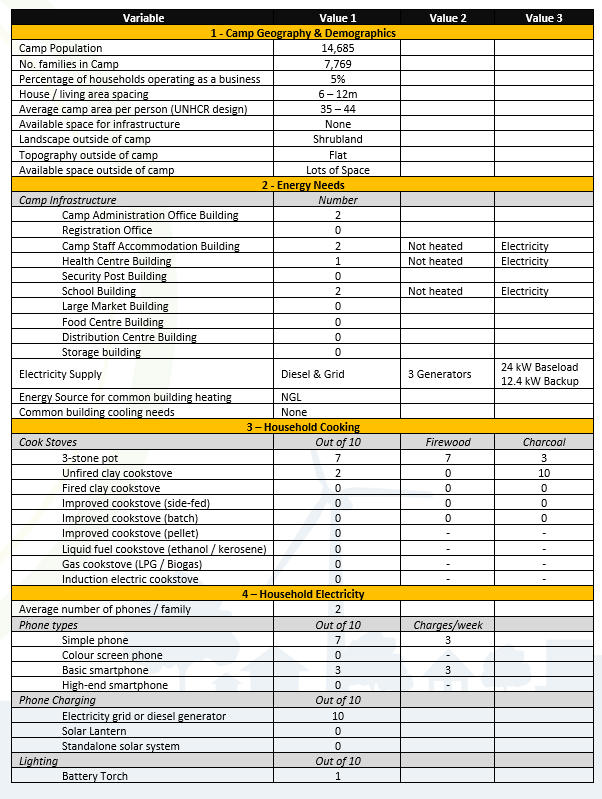
#1CampMapping, lists 9 questions about the number of people living in the camp, how many households operate businesses, its geography and the availability of vacant space,
#2CentralEnergyNeeds, lists 20 questions about camp buildings, the source of electricity and heat, the camp’s food centres, water supply, and street lights.
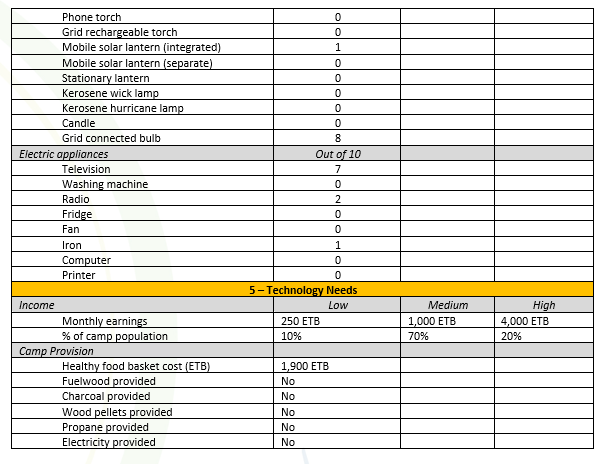
#3HouseholdCooking, lists 10 questions about cooking stoves and fuel use
#4 HouseholdElectricityLighting, lists 27 questions about use of mobile phones, lighting options available, and electrical appliances.
1.3.5 Step 5 - Guide to provide Camp Information - How
There are two types of questions to fill in for each camp
- Multiple choice (yellow fields) with a selection drop down list:
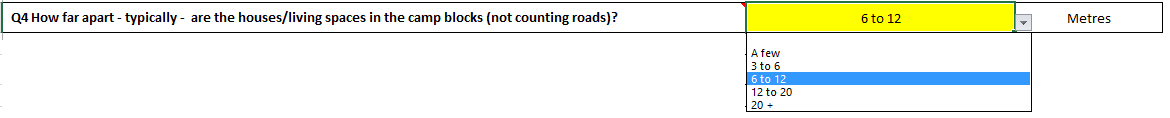
- Open questions (blue fields) where you need to fill in a quantity or a name

In some cases you may be prompted that you have filled in an answer that falls outside of the range that is possible (for example 12 out of 10 is not possible). If you fill in more or less than 10 when the totals should sum up to 10, you will be prompted to make sure as few errors as possible are entered.
1.3.6 Step 6 – Calculate Results to obtain a Baseline

The results are calculated in the “results” tab separately for each type of energy use:
Cooking Energy,
Household Lighting and Electricity,
Community Lighting and Electricity.
After you have filled in the answers to the tool questions for the first time, you can go to the results section and click on the calculate buttons.
Buttons for calculating results:


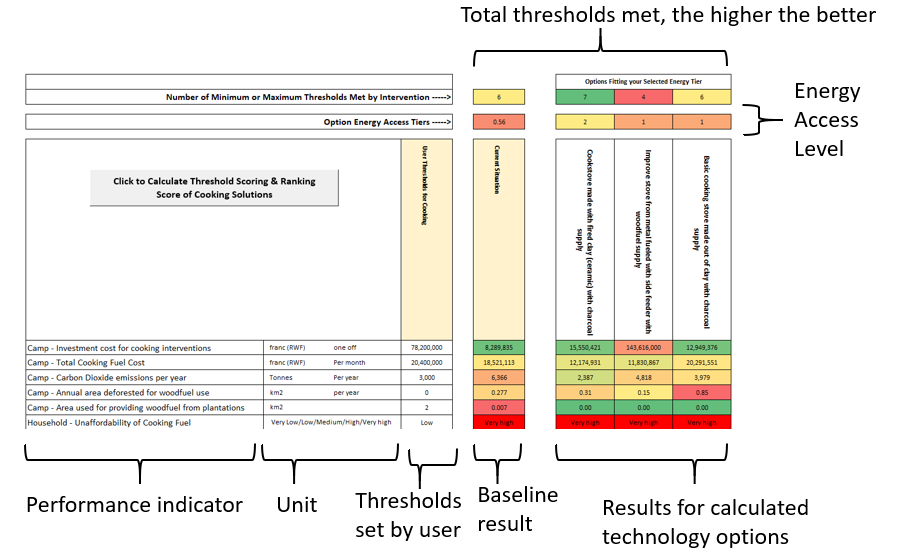
1.3.7 Step 7 – Read the Baseline Performance
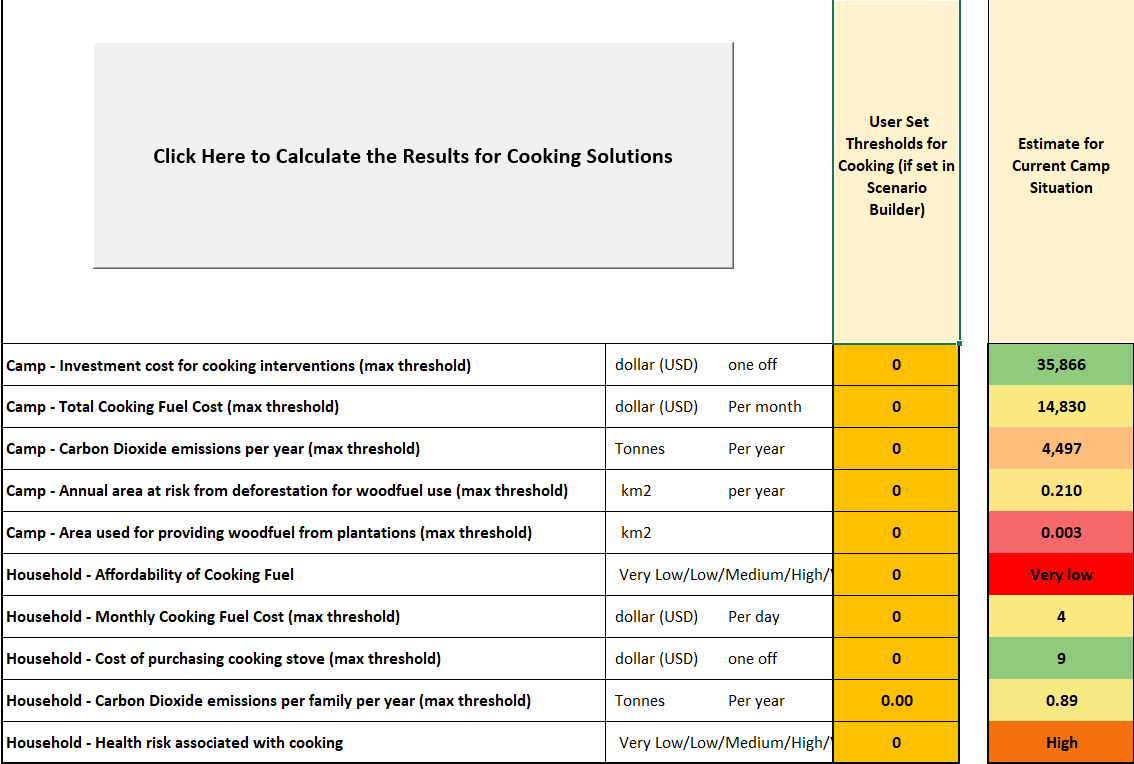
Baseline Performance Of Current Camp Situation
Cost 35,866 USD if existing stoves were to be bought again
Cost 14,830 USD to buy stove fuel per month
4,497 tonnes CO2 emissions per year from cooking stoves in camp
And so forth for all indicators
1.3.8 Step 8 – Set Energy Access Tier to Achieve
In the tab “Scenario Builder” you can set the Energy Access Tiers for Cooking, Lighting, Street Lighting, Electricity and Heating that the recommendations need to provide for:

The impact is that the 3 main recommended solutions will be selected within the desired tier of energy access (e.g. if selecting tier 1 the recommendations will be tier 1 options)
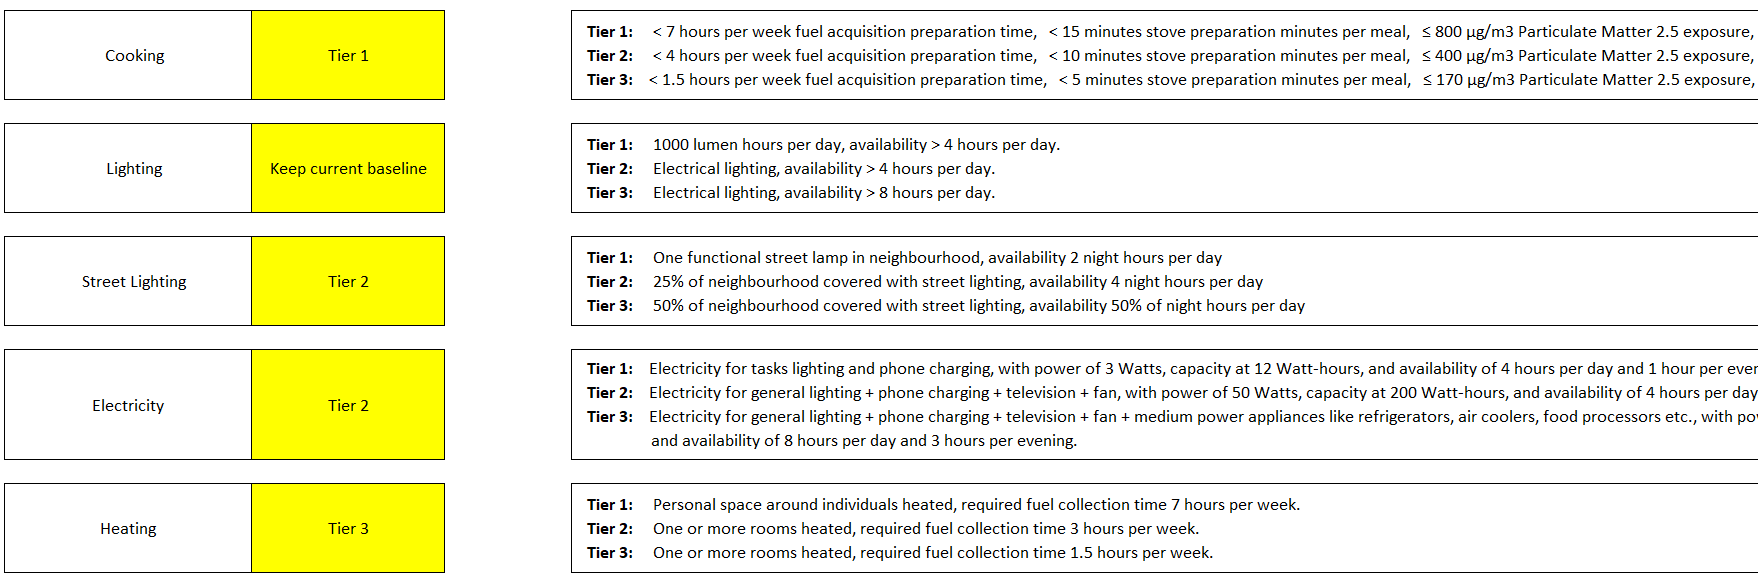
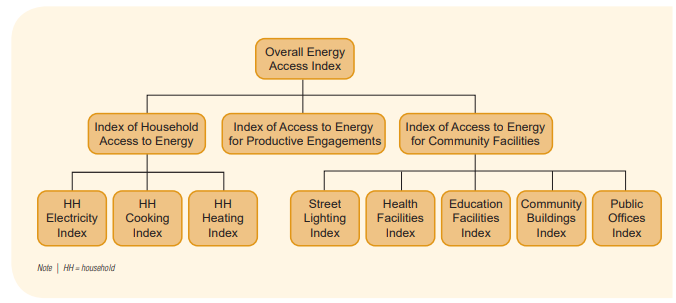
1.3.9 Step 9 – What are Energy Access Tiers?
The Energy Access Tiers framework was setup by ESMAP (Energy Sector Management Assistance Programme) to provide a common approach to understand the energy access for different types of energy use. It contains tables that outline under which conditions people or families achieve energy access levels ranging from 0 to 5 (see table below for the different type of indices).
More details can be found here: https://www.esmap.org/node/55526
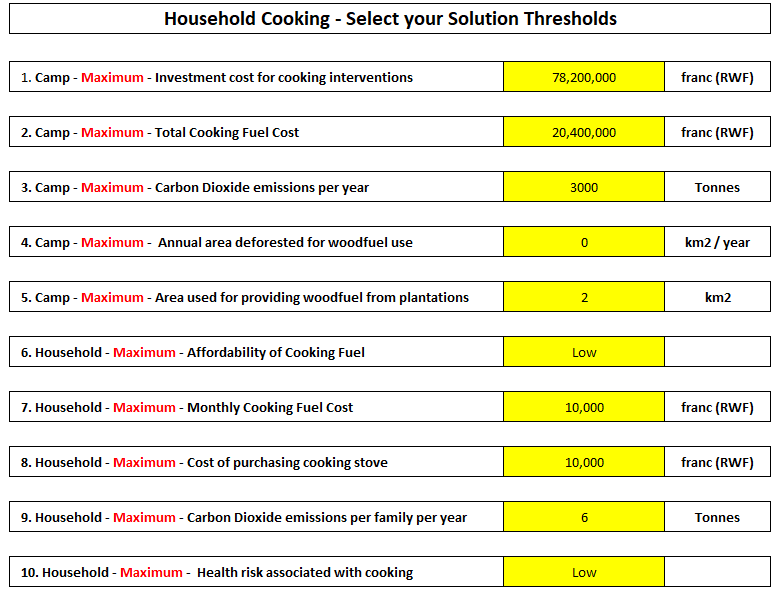
1.3.10 Step 10 – Set thresholds for indicators
In the tab “Scenario Builder” you can also set the minimum or maximum thresholds that a solution needs to take into account. Each technology solution is weighted on how many threshold option set by you it meets.
If there are 10 performance indicators (like for Cooking in v1) each cooking stove + fuel solution can receive a score between 0 and 10 points
Thresholds can be compared and set relative to the baseline situation. For example set a threshold that the cooking fuel cost per month should be at maximum as high as the current expenditure, or that the carbon dioxide emissions should be 50% lower in tonnage of CO2 per year.
Example Threshold Levels for Cooking Solutions to meet that are set by the user:
1.3.11 Step 11 – Re-run results with your Energy Access Tier + Thresholds
You can now re-run the results:
Cooking Energy,
Household Lighting and Electricity,
Community Lighting and Electricity.
1.3.12 Step 12 – Interpret your Results
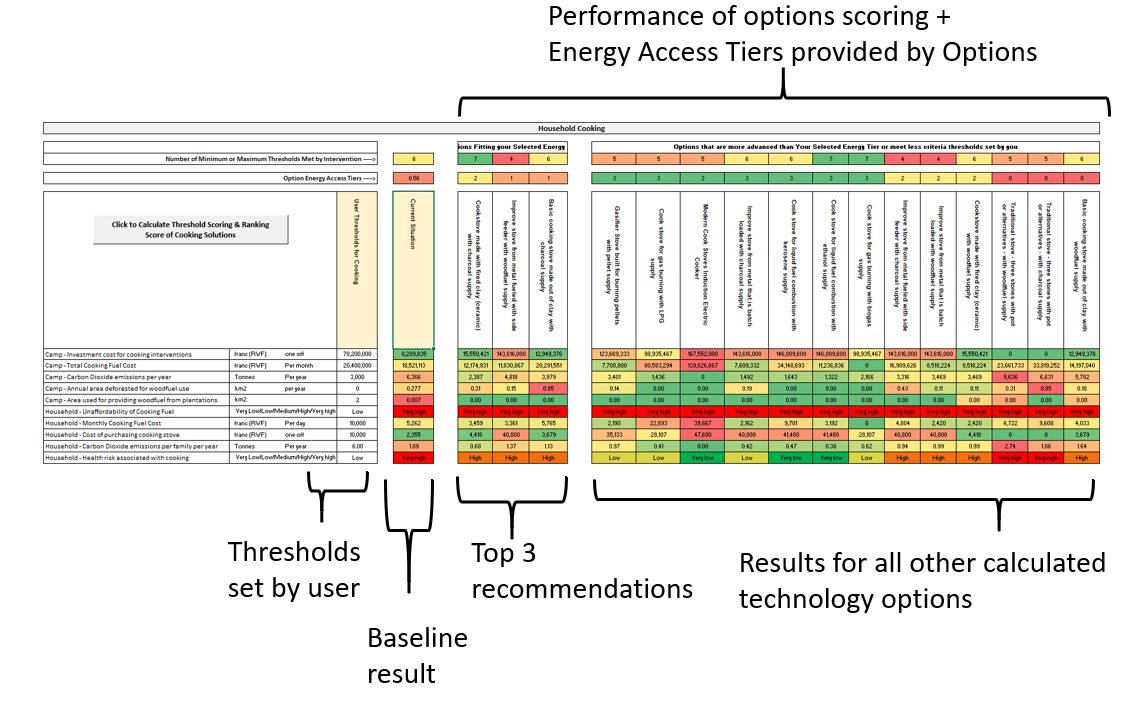
Note: The top 3 recommended options are not ranked or presented in any particular order, they are the three best performing options in relation to the scenario thresholds set by the user.
1.3.13 Step 13 – Make specific changes in technology specifications

In addition to the camp questions, in the “Parameter-Listing tab there are several hundred values that define the technologies compared in the model and the calculations.
For example, if you have specific data for a specific stove you can adjust that here, if you have specific information about the cost of solar, if you have data on the energy use of appliances, and so forth.
Any value in green can be edited here directly and this will change the calculations. Once editing a value here (or in the camp questions) you can run the results again and get an updated insight in the performance of the solutions.
1.4 Overview of Models and Methods used
The user guide explained the usage process for the RER tool. More detailed technical information can be found in the technical documentation made to describe the calculations carried out in the tool. An overview of the calculation steps is shown in the figure below.
Please see the technical documentation for more details
2 Technical Documentation for Tool Calculations
Authors: Rembrandt Koppelaar (Scene), Jonathon Nixon (Coventry University)
2.1 Overview of Calculation Flow
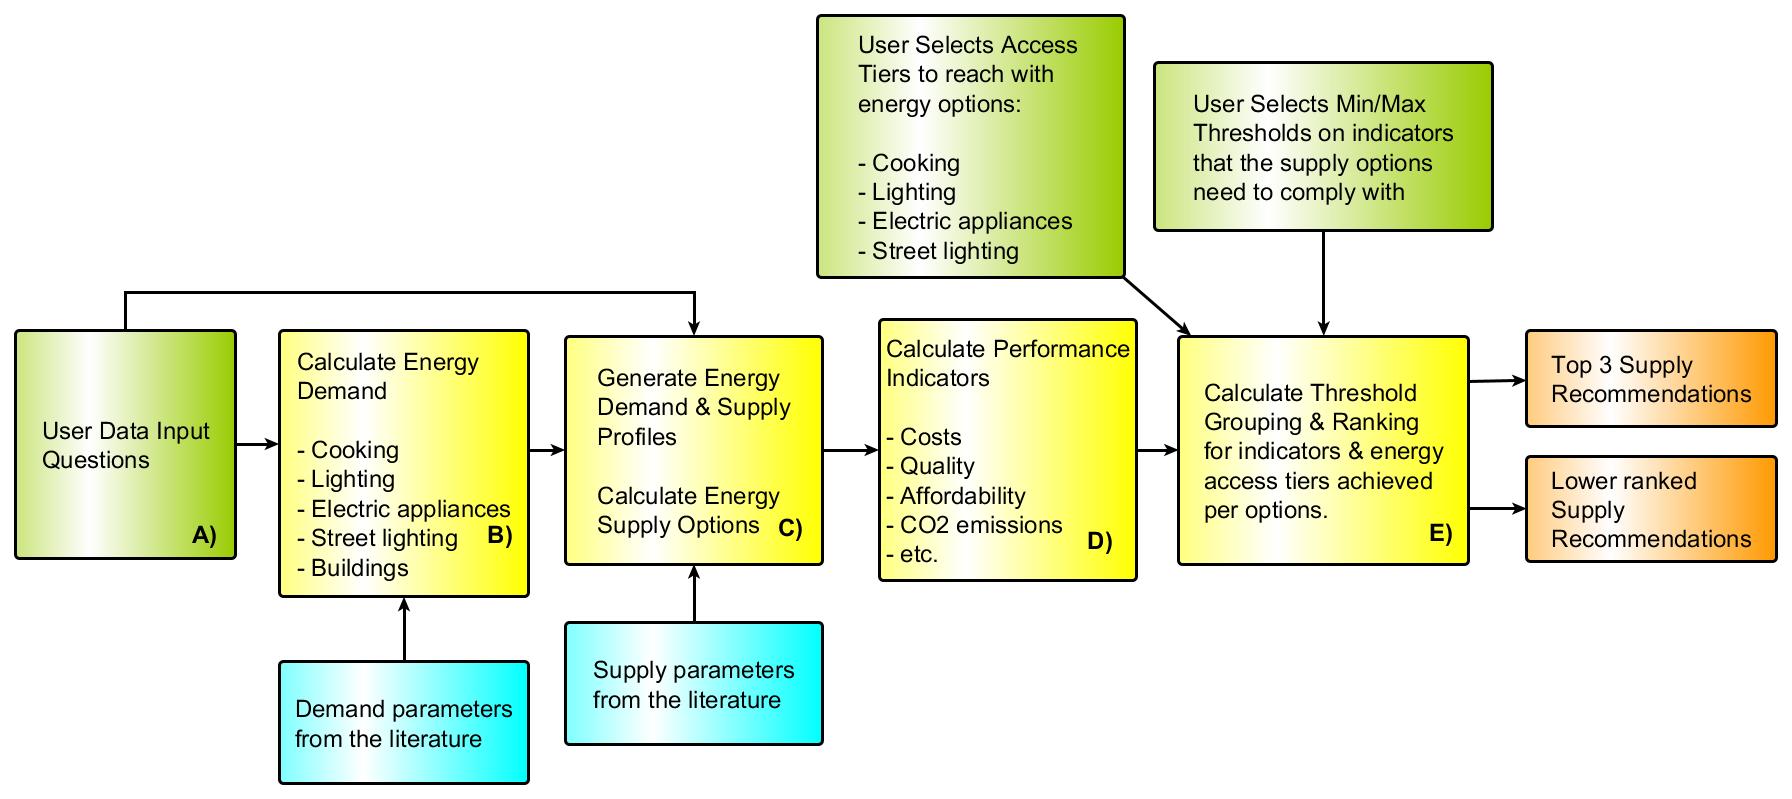
The calculation setup is a linear flow based on five calculation “modules”, and three mechanisms by which the user adds data and conditions for the calculations (see Figure 1). The setup is designed without iteration in a demand-driven manner, in that supply is calculated to match demands, in contrast to an equilibrium-based calculation. Any iterations will be carried out by the user, by enabling a real-time output change due to user input alterations.
Figure 1. Calculation Flow of the RERT Tool
Each of the calculation steps are described in the next sections including the parameters and user inputs as applicable. The energy demand calculations (B) are described in section 2, the calculations of supply options to meet the demands (C) are described in section 3. The calculation of performance indicators for energy supply options (D) is described in section 4, and the threshold grouping & ranking based on energy access tiers and indicator thresholds (E) is described in section 5.
2.2 Energy Demand Calculations
Generalised Equations for Energy Use Calculations
Energy use E in kWh is calculated for sets of devices with i = 1,2\ldots nas an index for the category of device, including cooking, lamps, streetlights, electric appliances, and electricity generation devices. The index j = 1,2\ldots n denotes the sub-type within a category, such as the type of cooking device for example, and k = 1,2\ldots n is an index for energy carrier type used including individual fuels and electricity. Energy use per period of time is thereby calculated as:
E_{\text{ijk}} = \ \frac{c_{\text{ijk}} \cdot \ u_{\text{ij}} \cdot \sum_{t}^{n}A_{\text{ijt}}}{\varepsilon_{\text{ijk}}} (1)
With \varepsilon_{\text{ij}} as the efficiency in %, c as a capacity parameter typically in kW, u as a utilisation parameter indicating the proportion of capacity used, A_{\text{ij}} as a variable for average daily device use in hours. The time index t = 1,2\ldots n indicated the number of days in a month to obtain monthly device energy use.
Fuel used in weight or volume unit can then be calculated as:
F_{\text{ijk}} = \frac{\text{\ E}_{\text{ijk}} \cdot 3.6}{f_{\text{ijk}}} (2)
With f_{\text{ijk}} as a variable for fuel energy content per fuel type \text{k\ }in MJ per kilogram for solid fuels or MJ per m3 for gaseous fuels.
Energy Use – Cooking Specifics
Cooking energy demand is calculated in an integral manner with supply, as the energy need is highly interrelated with the type of stove used and the efficiency of fuel utilisation. First, the tool estimates which cooking devices are used based on how common they are (X,Y,Z, stoves of type A,B,C, per 10 families) and what type of fuels are used for these stoves. Based on the questions posed to the user and particular answers the current fuel requirements are calculated. The equation (1) above for cooking devices i = c is used to calculate cooking device energy usage. Fuel used for cooking in weight or volume unit is calculated with equation (2) as applicable. Cookstove fuel energy content data was taken from Vianello et al. (2016).[1]
The combination of stoves and fuels results in a simplified approximation of the amount of “fuel stacking” that occurs, by allowing the user to set different fuel ratio’s per stove that is utilised on average. Fuel stacking is defined as the alternation between use of different fuels due to various factors including meal types, fuel prices, and disposable cash available.[2]
To establish the type of cooking devices \text{j\ }and their range of usable fuels k the literature was consulted. The aim was to find distinct devices by energy carrier type and efficiency parameter \varepsilon_{\text{ijk}}. First, international standards to make cookstoves comparable in terms of performance were consulted, of which the most prominent is the IWA standard was developed by the Global Alliance for Clean Cookstoves (GACC). The IWA standard classifies cooking stoves by tiers from 0 to 4 based on their efficiency, carbon monoxide and particular matter emissions (outdoor and indoor), and use safety. This standard was adopted to link to the efficiency parameter \varepsilon_{\text{ijk}} and for calculating air pollution/health indicators.
Second, studies with a comprehensive overview of different classifications of cooking stoves (traditional, improved, rocket etc.) were consulted.[3] As well as the categories of legacy and basic ICS, Intermediate ICS, Advanced ICS and Modern fuel stove as per Vianello et al. (2016)[1] Third datasets were analysed for cooking stoves in terms of their design, fuel use and IWA standard rating from lab and field tests. The main data sourced used was The Clean Cooking Alliance online cookstove catalogue with 476 stoves of which 81 have IWA efficiency ratings, and 60 have IWA indoor-emission ratings (see for the online catalogue: catalog.cleancookstoves.org). These were further supplemented with operational testing data for 15 different cookstoves on IWA parameters under lab conditions from Dean et al. (2015).[4] And with data from operational testing of fifty cooking stoves for efficiency, CO emissions and PM emissions by MacCarty et al. (2010).[5]
Standard categories for cookstoves as used in Viannelo et al. (2016)[1] were not found helpful, to make a meaningful distinction between the efficiency of cookstoves. Cookstoves in particular categories were not found to correlate with IWA tiers of efficiency and indoor emissions, plausibly due to the fluidity of the categories in defining the stoves the variety of quality of builds within these categories. The data analysis did yield relevant results, however, resulting in a new classification of 8 types of cookstoves. These are distinct in their fuel use and IWA efficiency tiers, so as to form a meaningful classification for household cookstoves in terms of IWA efficiency and IWA indoor emissions. The subsets were defined based on manually analysing distinct IWA values based on specific properties of cookstoves in the above datasets, such as the difference between batch-loaded and side-fed cookstoves, which together result in the classification as per table 2 and 3 below for IWA efficiency, and IWA indoor-emissions.
The capacity values for cookstoves c_{i = c,jk} and utilisation parameter u_{i = c,jt} were in the first iteration simplified to a standardised value of 1.0 kW for cookstove capacity, and an assumed 0.8 estimated for utilisation, indicating 80% utilisation of a cookstove’s capacity as it will not be fully loaded with wood or another fuel. The time of use variable value A_{\text{ijt}}was approximated at 2.5 hours per day assuming three meals per day. Analysis of these parameters has been carried out by Johnson & Chiang (2015)[6], Ruiz-Mercado et al. (2012)[7], Bentson et al. (2013)[8], Pillarisetti et al. (2014)[9].
Categorisation of stove subtypes:
Stoves built with (unfired) clay components are typically of a tier 0 to 1 IWA efficiency and a 0 to 1 IWA indoor-emissions, unless they have advanced features such as a chimney.
Stoves that are built with ceramic components (heated clay) in a metal housing are typically of a tier 2 IWA efficiency and a 0 to 1 IWA indoor-emissions efficiency.
Stoves that are side-fed are typically of a Tier 0 to 2 IWA efficiency and 0 to 2 IWA indoor-emissions. If they have a fan they are on the higher spectrum within these IWA efficiency and indoor-emissions ranges.
Stoves that are batch-loaded made from metal and burn on charcoal typically have a 3-4 efficiency tier and a 3-4 indoor emissions tier.
Stoves that are batch-loaded made from metal and burn on wood typically have a 2 IWA efficiency tier and a 0-1 indoor emissions tier.
No substantial distinction was found between IWA tiers for stoves with a fan as a single variable.
Fuels specific:
Ethanol/Alcohol burning stoves typically are of a Tier 4 efficiency and Tier 4 indoor-emissions category
Stoves that can also burn on crop residues typically have a 0-2 IWA efficiency and 0-2 IWA indoor emissions.
Stoves that burn on liquid petroleum gas typically have a 3 IWA tier for efficiency and indoor emissions.
Stoves that burn pellets with a gasifier typically have a 3 to 4 IWA tier for indoor emissions, and a 3 to 4 IWA efficiency for high power thermal efficiency, whilst their low power specific consumption tier can vary between 0 and 4 depending on design.
Stoves that burn on briquettes vary from 0 to 2 IWA Tier for efficiency and 0-2 Tier for indoor emissions.
Note that more data is required to properly analyse these findings (outside of the scope of the renewable energy recommendations tool effort/HEED project) as the datasets utilised and available are too limited to draw robust conclusions.
Table 1. Overview of cook-stoves implemented in the model in relation to utilisable fuel types
| Fuel type Cookstove | Wood | Charcoal | Pellets | Ethanol | Kerosene | LPG | Biogas | Electricity |
|---|---|---|---|---|---|---|---|---|
| Traditional three stone with pot stove | X | X | ||||||
| Unfired Clay Stove | X | X | ||||||
| Ceramic Clay stove in metal housing | X | X | ||||||
| Side-fed metal stove | X | X | ||||||
| Batch-loaded metal stove | X | X | ||||||
| Pellet gasifier stoves | X | |||||||
| LPG/Bio-gas stoves | X | X | ||||||
| Liquid Fuel stoves | X | X | ||||||
| Electric cooking stoves | X |
Table 2. overview of cook-stoves implemented in the model in relation to IWA efficiency tiers
| Fuel type Cookstove | Wood | Charcoal | Pellets | Ethanol | Kerosene | LPG | Biogas | Electricity |
|---|---|---|---|---|---|---|---|---|
| Traditional three stone with pot stove | 0 | 0 | ||||||
| Unfired Clay Stove | 0-1 | 0-1 | ||||||
| Ceramic Clay stove in metal housing | 2 | 2 | ||||||
| Side-fed metal stove | 0-2 | 0-2 | ||||||
| Batch-loaded metal stove | 2 | 3-4 | ||||||
| Pellet gasifier stoves | 3-4 | |||||||
| LPG/Bio-gas stoves | 3 | 3 | ||||||
| Liquid Fuel stoves | 4 | 4 | ||||||
| Electric cooking stoves | 4 |
Table 3. overview of cook-stoves implemented in the model in relation to IWA indoor-emission tiers
| Fuel type Cookstove | Wood | Charcoal | Pellets | Ethanol | Kerosene | LPG | Biogas | Electricity |
|---|---|---|---|---|---|---|---|---|
| Traditional three stone with pot stove | 0 | 0 | ||||||
| Unfired Clay Stove | 0-1 | 0-1 | ||||||
| Ceramic Clay stove in metal housing | 2 | 2 | ||||||
| Side-fed metal stove | 0-2 | 0-2 | ||||||
| Batch-loaded metal stove | 0-1 | 3-4 | ||||||
| Pellet gasifier stoves | 3-4 | |||||||
| LPG/Bio-gas stoves | 3 | 3 | ||||||
| Liquid Fuel stoves | 4 | 4 | ||||||
| Electric cooking stoves | 4 |
Energy Use – Household Lighting
Lighting energy needs are calculated on the basis of equation (1) with i = l with subtypes j using energy carriers k. Capacity of a light source for lighting c is expressed in Wh/hour, the \varepsilon parameter is not utilised here and set to 1. Values for Average use per day in hours\text{A} can be entered by the user and are pre-loaded with literature values from surveys.[10] The utilisation rate u is set to 0.95 indicating the frequency of using the lighting source.[10] In case of kerosene lamps, fuel use can be calculated using equation 2 to obtain litres of Kerosene used per family per month.
Capacity values for solar lighting devices were obtained from specification sheets in the lighting global database (http://www.lightingglobal.org/products/) which were averaged to obtain a representative value. Flashlight data was taken from Evan’s et al. (2015)[11] and Kerosene Lamp data from Mills et al. (2003).[12] Values were also obtained for specific torches/flaslights from product data on the Kenyan electronic goods website www.jumia.co.ke.
Table 4. types of lighting devices and their parameters used
| Total Capacity Wh | Hourly cons. (Wh/h) | Total hours of usage | Max. Lumens* | Panel Watts | Fuel fill (Wh) | Fuel Cons. (Wh/h) | Source of data | |
|---|---|---|---|---|---|---|---|---|
| Battery torch/flashlight | 3.20 | 0.03 | 120 | 120 | - | - | - | www.jumia.co.ke - SK68 LED Torch Cree - CREE XPE Mini LED Flashlight - LED Flaslight |
| Mobile phone torch/flashlight | 30.40 | 0.15 | 200 | 100 | - | - | - | www.x-tigi.com |
| Rechargeable battery torch/flashlight (sealed battery) | 1.90 | 0.38 | 5 | 300 | - | - | - | www.jumia.co.uk |
| Solar lantern (mobile) with integrated solar panel | 1.70 | 0.31 | 5.5 | 35 | 0.45 | - | - | www.lightingglobal.org |
| Solar lantern (mobile) with pico solar panel (<10 W) | 10.50 | 1.55 | 6.8 | 142 | 4.00 | - | - | www.lightingglobal.org |
| Solar lamp(s) (stationary) with pico solar panel (<10 W) | 14.40 | 3.07 | 4.7 | 500 | 5.60 | - | - | www.lightingglobal.org |
| Kerosene wick lamp | - | 12.6 | 8 | - | 1042 | 83 | Mills (2003)[12] | |
| Kerosene Hurricane Style Lamp | - | 7.9 | 36 | - | 2257 | 285 | ||
| Candles | - | - | 7.5 | 12 | - | 1476 | 197 | Grimm et al. (2005)[13] |
| Grid connected stationary LED lighting | - | 2.50 | - | 350 | - | - | Mills et al. (2015)[11] |
Universal Powerbank phone S23
- Ultabright USB-rechargeable LED Torch
Mills et al. (2015)[11]
Waka Waka
D.light S3
Enviro SL36
Sun King Pico Plus
PSHS 3000
Sun King Boom
CAA Solar Lantern
Lagazel Kalo 3000
Sun King Pro easybuy/Pro X
Shanghai Easy Solar Home Light Kit (2 lamps)
Poly oslar 10W Solar Home Lighting System
Sun King Home 40Z
Solarway Solar Home Power System
WOWSolar 60
*Total value across multiple lamps if systems have multiple lamps.
Energy Use – Mobile Phones
The electricity use for mobile phones i = m per month in kWh is estimated on the basis of the number of times the phone is charged per day, r_{j} ,multiplied by the time-period of use, t, the electricity required for a full charge as battery capacity, \theta, and the average depth of charging from a discharged to charged state, d , as:
E_{j} = r_{j} \cdot \theta_{j} \cdot d \cdot t (3)
The assumption for the depth of charging parameter d is 0.8 indicating an 80% average charge of the battery capacity. Electricity required for a full charge, and the number of times charged per day, vary depending on phone type j = 1,2,3,4 with four types of phones distinguished in the model:
‘Dumb’ phones that have no internet access capabilities
Feature phones that can access the internet and run one app at a time
Low end smart phones that have costs 50 pounds or less, typically restricted to 3G capability
High end smart phones that have all modern phone capabilities
To obtain values for \theta battery capacities for a wide range of phones were evaluated as sold in low- and middle-income countries based on vendor websites, such as www.jumia.co.ke, and specific popularity tech articles (Maina 2017)[14], resulting in a selection of smartphones listed in Table 5 below.
Table 5. Mobile phone brands for which capacity data was obtained to obtain charge value averages
| Dumb phones | Feature phones | Low-end smart phones | High-end smart phones |
|---|---|---|---|
| Nokia 150 | Nokia 3310 | Oukitel C9 | Samsung Galaxy J1 Ace |
| Alcatel one Touch 10.35X | Doro 6050 | FreeTel ICE 3 | Samsung Galaxy J5 |
| Nokia 225 | Alcatel OneTouch | Motorola Moto C | Huawei P8 Lite |
| Samsung E1270 | STK R45i | viWa i7 | Samsung Grand Prime Plus |
| Nokia 105 | Huawei P9 Lite | ||
| Nokia 3310 | Samsung Galaxy S5 | ||
| Amplicomms PowerTel | Samsung Galaxy S6 | ||
| iTel 2080 | Samsung galaxy S7 edge | ||
| iTel 5010 | Infinix Hot 4 | ||
| iTel 5610 | Infinix Hot 4 Lite | ||
| Samsung Guru | Tecno Y3+ | ||
| Tecno C8 | |||
| Infinix X507 | |||
| Xiaomo Redmi Note 4 | |||
| Oppo a37F |
Capacity is measured by the industry in electrical charge as milliamp-hours. To establish battery capacity in terms of energy usable in kilowatt-hours, the mAh value is converted by multiplication with the battery voltage (typically 4 volt) as:
\theta_{j} = \frac{\text{mAh}_{j}\ \cdot V}{10^{6}} (4)
The following values were obtained at 0.0035, 0.0044, 0.0079, and 0.0120 kWh for dumb, feature, low end, and high-end smart phones, based on the average for each category of the phones in Table 5, respectively. To obtain values for the number of times the phone is charged per day, r_{j} , values were consulted from the literature to obtain a base value for charging frequency.[15] In the tool the user can insert the distribution across the four mobile phone types, the number of phones owned by a family, and the charging frequency estimate.
Table 6. Default parameter values used for mobile phones
| Charge (kWh) | Default values for charging frequency (times per week) | |
|---|---|---|
| Dumb phones | 0.0035 | 12 |
| Feature phones | 0.0044 | 9 |
| Low-end smart phones | 0.0079 | 5 |
| High-end smart phones | 0.0120 | 5 |
Energy Use – Electric appliances
The energy use associated with electric appliances is informed by user questions about the number of appliances per family (x out of 10 families), and for variable appliances their utilisation rate per day in hours.
Appliance use is then calculated using a simplified version of formula (1) as:
E_{\text{ijk}} = \ c_{\text{ijk}} \cdot \ \sum_{t}^{n}A_{\text{ijt}} (5)
The capacity value in watts is predetermined based on literature values. A preliminary assessment for capacity wattage can be found in Table 6 below. Values for appliances sold with Solar Home Systems were taken from the validated catalogue from www.lightingglobal.org, and the study by Phadke et al. (2015).[16] Values for other appliances were derived from the studies of Blodgett et al. (2017), Hartvigsson and Ahlgren (2018), the LEAP 2017 off-grid appliance market survey, and the GIZ 2016 Catalogue of DC Appliances for Photovoltaics.[17]–[20]
A total of five appliances are included in the first version of the Renewable Energy Recommendations Tool, as listed in Table 6 with the data values. Further expansion will be made in a future version. The duration of use for each appliance was simplified based on taking an estimated 2 hour per day value for each appliance as a default value, with the possibility of creating specific per appliance use durations where data is available. Users can adjust the parameters to create localised solutions based on specific appliances.
Table 7. Electricity Input requirements for Electric Appliances
| Appliance | AC/DC | Type/Context | Wattage | Included in V1 RERT |
|---|---|---|---|---|
| Television | DC | With Solar Household System | 10.8 | No |
| Radio | DC | With Solar Household System | 5.0 | No |
| Fan | DC | With Solar Household System | 20.0 | No |
| Small Fridge 50 Litres | DC | No | ||
| Television | AC | Standalone / without SHS | 88.0 | Yes |
| Radio | AC | Standalone / without SHS | 26.0 | Yes |
| Fan | AC | Standalone / without SHS | 20.0 | Yes |
| Air Cooler | AC | 100.0 | No | |
| Small Fridge 50 Litres | AC | 40.0 | Yes | |
| Small Fridge + Freezer | AC | 120.0 | No | |
| Music system | AC | 75.0 | No | |
| Laptop | AC | 60.0 | No | |
| Iron | AC | 1000.0 | No | |
| Washing Machine | AC | 500.0 | Yes | |
| Hair dryer | AC | 900.0 | No | |
| Microwave | AC | 900.0 | No |
Energy Use – Street lighting
The number of streetlights in the current situation is informed by the answers from the user in terms of the housing density and the % of main roads area covered by grid connected or solar streetlights. It is assumed that streetlights are placed only on main roads.
The main road area length, R, is approximated based on the number of families in the camp,n, the average camp area per person, x, in m2, a percentage of main road area per camp area parameter, s, and the average width of roads or streets, w, as:
R = \frac{n \cdot x \cdot s}{w} (6)
The value of the parameter s will vary per camp and is to be established (pre-loaded) by analysis of satellite imagery for a sample of refugee camps. As a standard value 3% is assumed.
After the main road area length is calculated the number of streetlights can be determined based on the spacing,\text{\ S}, required per pole. The formula for this is taken from Shehadeh (2015)[21] as:
S = \frac{l \cdot u \cdot 0.8}{lt \cdot w} (7)
With\text{\ l} as the amount of lamp lumens,\ u, as a coefficient of utilisation, and\text{\ lt}, as a threshold minimum required average illumination in lumen per m2. The number of estimated streetlights thereby varies depending on the quality of the light source.
The type of existing streetlights are informed by the user questions on how long the street lights typically are on during the dark hours in terms of hours, whether they are grid connected or solar street lights.
Two main types, j, of streetlights are incorporated, a solar streetlight and a grid connected High Pressure Sodium (HPS) gas discharge street light. It is assumed that the solar streetlight integrates a lamp, battery and solar panel per light.
Electrical energy used E for streetlights is calculated using equation (1) above based on the efficiency \varepsilon of streetlights, the standardised capacity, c, the usage hours per day A, and the coefficient of utilisation u.
A solar supply calculation is carried out to establish the solar-PV and battery sizing of the solar streetlights to match with the hours of use required for the ESMAP street-lighting energy access tier. In case of tier 1 a night-time availability of 2 hours per day is required, in case of tier 2 a 25% neighbourhood coverage and 4 nights per day availability, and in case of tier 4 a 50% neighbourhood availability and 50% of night hours per day is required. By selecting a particular energy access tier the number of street lights required are multiplied to achieve the required coverage, and in case of solar street lights, the type of street lights are altered so as to achieve night-time availability.
Energy Use – Camp Community & Management Buildings Cooling & Heating
The energy use for central camp buildings cooling and heating was estimate using the heating and cooling degree day method. Heating Degree Days (HDD) are expressed as the average number of degrees for a day above a specified base temperature for a period (monthly or yearly). Cooling Degree Days (CDD) are the opposite, as the number of degrees for a day below a specified base temperature. Usually these values are expressed in a cumulative manner for a particular period, such as the monthly or annual HDD or CDD. Cumulative annual HDD and CDD per country was taken from the CMCC-KAPSARC database developed by Atalla et al. (2018) containing values for 147 countries from 1948 to 2013.[22]
The energy use associated with HDD and CDD is estimated based on an amended version of the formulation in Sarak & Satman (2003)[23], resulting in the formula:
E_{j,t} = \frac{m\ \cdot \ U}{H\eta_{j}}{p \cdot DD}_{t} (8)
With E as energy consumption, p, as the share of time that the system is heating or cooling for non-continuous operation, \ m as the building surface area in m2, \ U as the building heat transfer coefficient in W per m2 per degree, H, as the fuel heating value (with 1 if no fuel is used), \eta, the efficiency of the heating system per type j, and \text{DD} the cooling or heating degree days value.
Standardised values used for these parameters as described above used to calculate cooling and heating systems can be found in table 8 below. Users can adjust the parameters based on more advanced studies or specific localised technology systems for particular camps.
Table 8. Standard Values for Buildings for Heating and Cooling
| Building Type | Typical building size (m2) | Heating Time % | Building heat loss coefficient (AU) | Heating Systems Efficiency | Cooling Time % | Cooling System efficiency (%) |
|---|---|---|---|---|---|---|
| Administrative office building | 300 | 10% | 1.5 | 45% | 30% | 45% |
| Registration office | 50 | 10% | 1.5 | 45% | 30% | 45% |
| Camp Staff accommodation building | 200 | 10% | 1.5 | 45% | 30% | 45% |
| Health centre building | 150 | 10% | 1.5 | 45% | 30% | 45% |
| Security Post Building | 100 | 10% | 1.5 | 45% | 30% | 45% |
| School building | 300 | 10% | 1.5 | 45% | 30% | 45% |
| Large Market Building | 500 | 10% | 1.5 | 45% | 30% | 45% |
| Food Centre Building | 500 | 10% | 1.5 | 45% | 30% | 45% |
| Distribution Centre Building | 100 | 10% | 1.5 | 45% | 30% | 45% |
| Storage Building | 200 | 10% | 1.5 | 45% | 30% | 45% |
Energy Demand – Water Supply
The water supply requirements were first established, based on a fixed average demand per camp family for low, medium and high-income families with a distribution as provided by the user. For example, data surveys for Ghana’s capital city Accra provide a range of 25-50 litres per day per capita for low income families, 50-90 litres per day per capita for middle income families, and 90 to 140 litres per day per capita for high income families.[24] Water usage is influenced by the type of supply and its intermittency. UN guidelines for refugee camps indicate a minimum requirement of 20 litres per person per day that should be available. Water usage surveys for refugee camps indicate a wide range of water availability with about 53% of camps in 2005 meeting the 20 litres per day standard on average (excluding distribution effects). [25],[26]
The tool does not estimate the amount of water used, instead the electricity use for water use is defined based on the number of electrically run ground water pumps installed in the camp. It is assumed that water supplied from local boreholes and is not treated for improving the quality. In addition, if the water comes from an external piped system then no direct energy use is assumed for the camp energy use.
The energy use for groundwater pumps is calculated based on the total vertical distance from the groundwater source to the points of consumption, the hours of operation, and a standard hydraulic pumping equation that incorporates the flow needs for water usage. The hydraulic power equation utilised is expressed as:
P_{\text{hydraulic}} = H \cdot \rho \cdot g \cdot Q*(1 + \varepsilon) (9)
Where H is the difference in height between the inlet and outlet of the pipe from the pump under which the fluid is lifted, in this case water, \rho is the density of the fluid involved, g is the gravitational constant, Q is the desired low rate per second, and \varepsilon is an efficiency factor that captures the friction of the pump system.[27] The equation captures the main factor of influence on the energy costs: the vertical distance to which the water needs to be lifted, both within the borehole, and between the borehole and the point of use. For example, a height difference between 50- and 200-meters lift can result in an increase from 0.3 to 1.2 kWh/m3 of water pumped for a 44% efficient pump.1
As a standard value for the desired flow rate Q a value of 0.0006 m3 per second is used, which amounts to a little over 2 cubic metres per hour or over 50 cubic metres if operating constantly during a 24-hour period. The standard parameters used for pump efficiency are 44%, and for the friction in the pump system is 10%. The system efficiency fin converting electricity to mechanical energy to lift the water is based on a large number of real life evaluations (Conlon et al. 1996).[28] Based on these values total energy costs amount to 0.24 kWh per m3 of water pumped for a 35 meter vertical distance.
2.3 Energy Supply Calculations
Linking Energy Demands to Energy Supply Sources
The Renewable Energy Recommendations Tool works by generating a total demand side profile for different types of energy use divided into:
Cooking energy use requirements for camp families/households for use in cooking stoves.
Centralised electricity energy use requirements for camp community buildings/uses, camp management/NGO’s, and streetlighting, as well as water pump requirements.
Decentralised electricity energy use requirements for camp families/households, including lighting, mobile phone, and electric appliance utilisation.
After calculating profiles for one or more of these demands (depending on user interest) the tool will first calculate the baseline demand based on the current energy infrastructure in the camp, as entered in the tool by the user. This provides for a baseline current energy situation assessment.
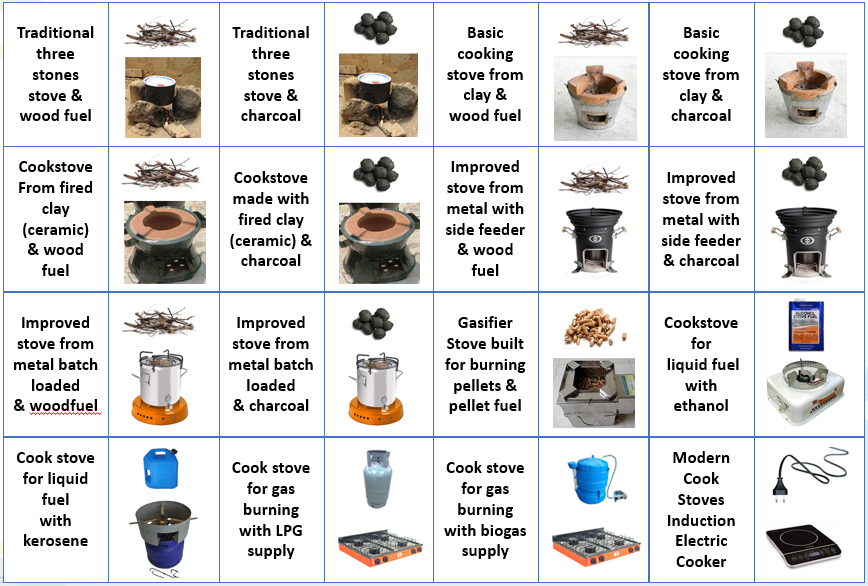
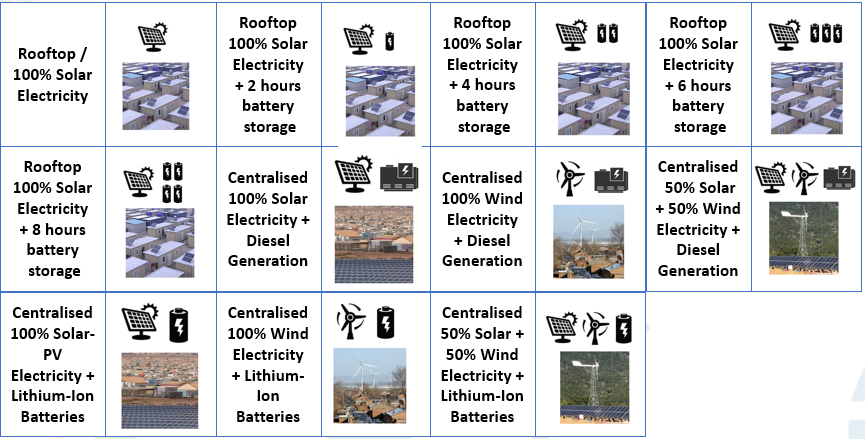
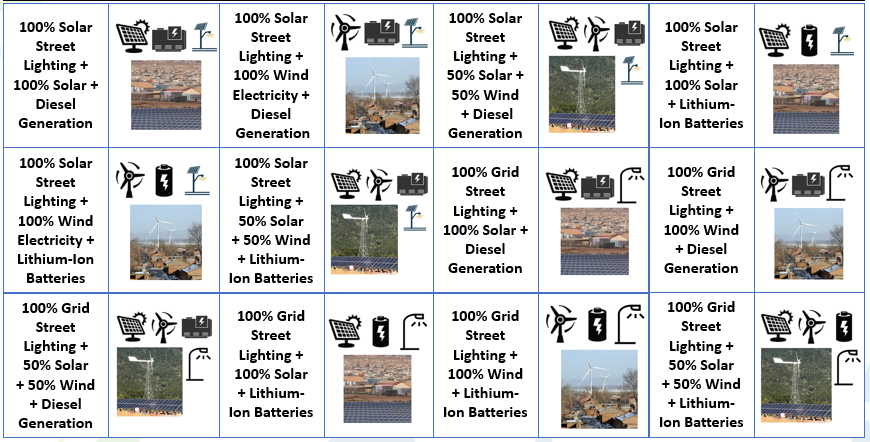
Subsequently, the tool seeks to calculate how the demands can be met using different supply options. In the current version a total of 16 cooking stove options are evaluated (Figure 2), a total of 11 options for camp family/household electricity supply (Figure 3), and a total of 12 options for centralised electricity use for camp community buildings, main buildings, streetlighting and water pumping needs (Figure 4).
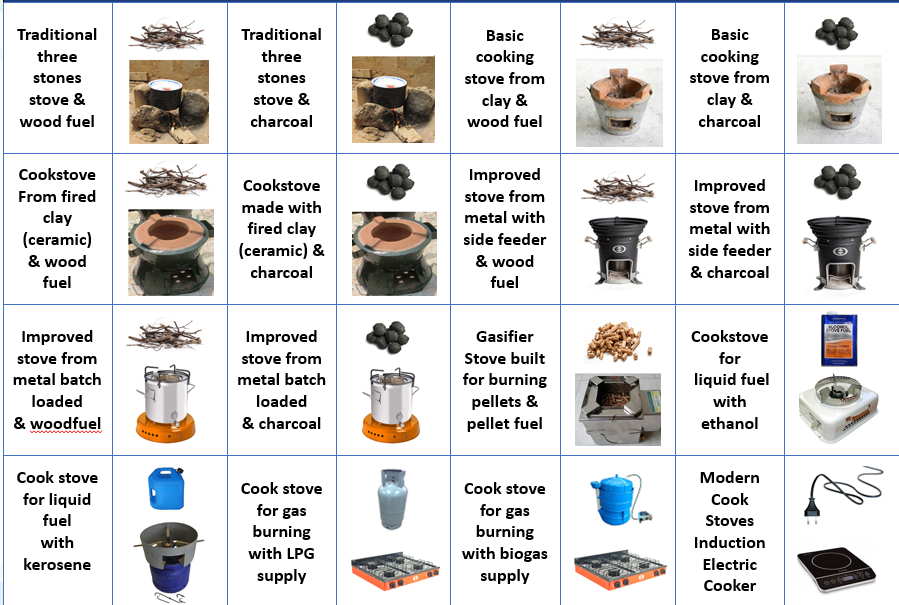
Figure 2. Cooking Stove Options Compared in V1 of RERT
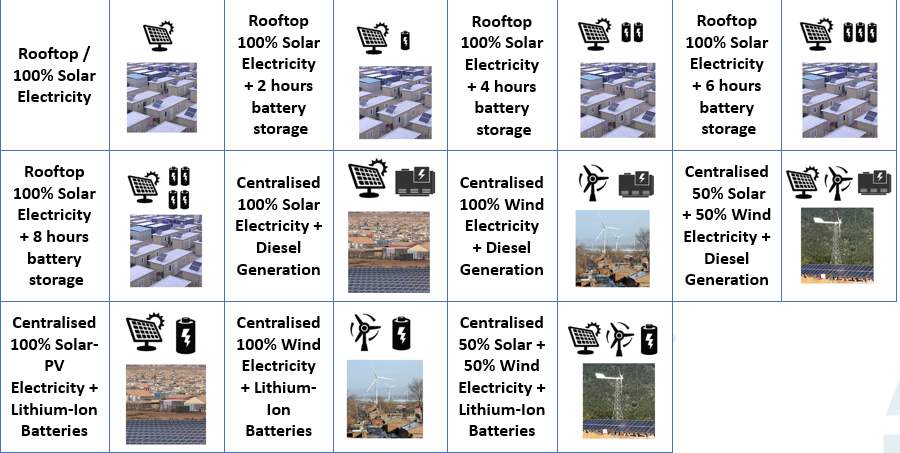
Figure 3. Household/Family Electricity Supply Options Compared in V1 of RERT
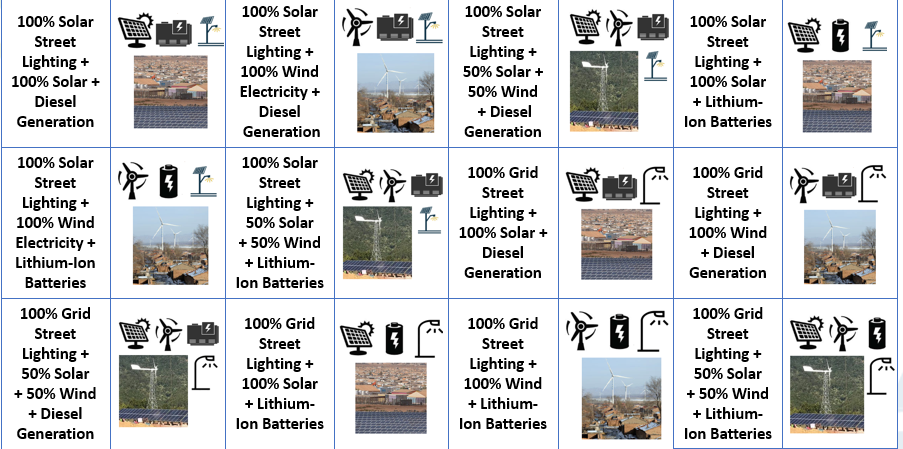
Figure 4. Camp Community/Institutions Electricity Supply Options Compared in V1 of RERT
Translation of cooking fuel demands into a load profile
The calculation of cooking fuel demand and supply was described in section 2 under the cooking energy use section. In brief the demands are based on the population in the camp, the stove distribution, the type of fuels used in the stoves, and use duration, stove efficiency and capacity parameters. The calculation results in the aggregate fuel use in the camp. To calculate new fuel supply needs the tool estimates what the requirements are for different type of stove options (16 in total as mentioned above. Based on the assumption that each family/household will utilise one stove type as a simplification, with multiple fuel options.
Translation of household/family electricity demands into a load profile
To evaluate the electricity supply options for households/families the electricity use needs to be translated from energy usage in kWh into a power demand profile requirement in watts per hour, E_{j,t}^{d}. An aggregate approach is utilised based on which total electricity use is superimposed on the same electricity use pattern by category.
Three different categories are utilised:
Low appliance household/Family electricity use pattern, who do not utilise any appliances beyond mobile phones and lighting
Medium appliance household/Family electricity use pattern, who own and use a television and/or an electric radio.
High appliance household/Family (with a business) electricity use pattern, who own and use the above as well as an electric washing machine or a small food fridge or an electric fan or combinations of the three.
The divisions of electric appliances are based on the ownership questions posed to the user. For each of the three household/family categories a different electricity use load profile is applied and superimposed on total electricity use. The profile determination builds upon the data in Blodgett et al. (2017) with combined energy use surveys and measured data from SteamaCo mini-grids of 176 households in Kenya.[20] Load profile data is also available in Hartvigsson and Ahlgren (2018) but here it is based on only survey data to elicitate time of use information from 47 households in Tanzania, which is less reliable.[19] The analysis in Blodgett et al. (2017) yields three user types, “night users” that utilise their electricity mostly from 18:00 to 24:00, “day users” that utilise their electricity mostly from 08:00 to 20:00, and “mixed users” that utilise about 60% of their electricity in the evening and 40% during the day (see Figure 3 below). Day users are mostly businesses and mixed users are mostly mixed business/households.[20]
In the simulation the low and medium appliance household/family users the profile from Blodgett et al. (2017)[20] for day user groups is applied, whilst for the high appliance household/family users the mixed user group profile is applied.
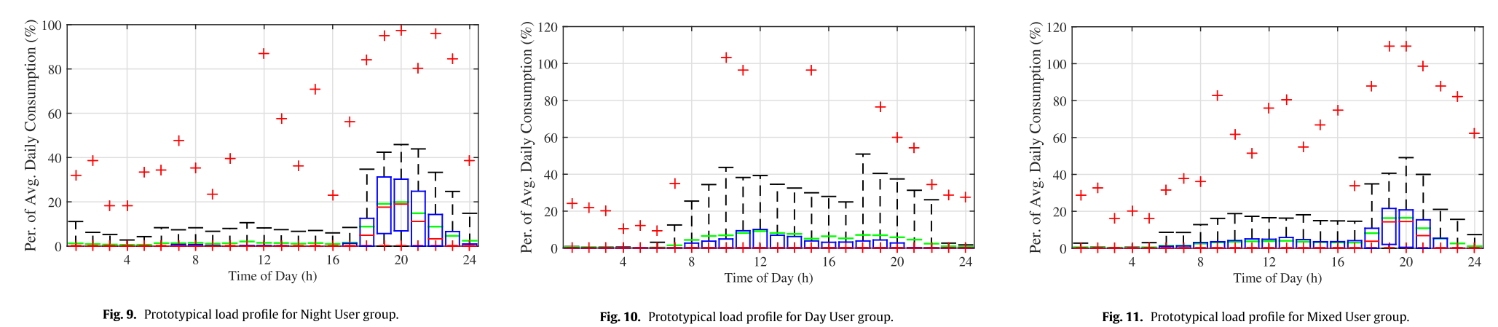
Figure 5. Load profiles for night users (left), day users (middle), and mixed users (right).
Figure adapted from Blodgett et al. (2017) [20]
Translation of community/institutional electricity use into a load profile
Similar to the households/family’s evaluation, the community/institutional electricity use needs to be translated from energy usage in kWh into a power demand profile requirement in watts per hour, E_{j,t}^{d}. To this end an aggregate approach is utilised based on different types of energy uses that are distributed over hourly slots across the day. The estimations are carried out by informed assumptions that can be adjusted by the tool user as required. The following standard assumption are made:
Water pumping energy use, distributed from 07:00 in the morning until the end of the evening at 23:00.
Building Heating energy use, distributed from 00:00 at night until 05:00 in the morning.
Building Cooling, distributed from 14:00 in the afternoon until 01:00 in the morning.
Street Lighting, varying by energy access tier from 19:00 until 21:00, 23:00 or later in the night.
Community Cooking, distributed from 08:00 to 10:00 in the morning, 13:00 to 15:00 in the afternoon, and 19:00 to 21:00 in the evening.
Note that in case buildings are not assigned to have heating or cooling by the user, or if no community cooking takes place, these values will amount to zero in the calculations.
Energy Supply – Electricity for Household/Family and Institutional/Community needs
The nameplate capacity, C, required to provide electricity supply E^{l} per year was calculated for fuel stock based generation options based on the facility lifetime t = 1,2,\ldots l, the capacity factor of the power generation unit, f, and the degradation \sigma of the annual capacity factor, using:
C_{j} = \frac{E_{j}^{l}}{(f_{j,t} - \sigma_{j,t}) 8760} (10)
Parameters for electricity supply options were taken from Kis et al. (2018).[29] In case of intermittent wind and solar-PV sources a different approach was taken to establish the required capacity. First, an hourly profile was generated using the Merra-2 Global dataset using the renewables ninja tool.2 In case of solar a zero tracking system was assumed with a system loss or performance ratio, \upsilon, estimated at an average of 80% based on real-life evaluations from tens of thousands of existing solar systems from the literature.[29] Second, a lithium-ion battery supply option is added where relevant, in order to meet the availability needs for the electricity supply in the evening.
Third, the generation source is scaled in terms of capacity to match the respective supply point output needs to meet demands. The scaling is done based on a three step procedure:
The maximum kWh among hourly loads of demand across the entire year is selected,
The value is multiplied by a factor, so as to minimize the lack of supply on sunless or windless days.
The selected factor for combined large scale (centralised) battery plus solar and/or wind system is selected at 1.2, to further oversize the system slightly and enable more constant power supply.
The selected factor for household/family solar-PV is set to 0.2, in case of solar-PV plus 2 hours of batteries it is set to 0.4, for solar-PV + 4 hours of batteries it is set to 0.6, and for solar-PV plus 6 and 8 hours of battery it is set to 1. The scaling is selected to be closer to average (instead of maximum loads) to optimise costs, and gradually increase with battery systems included, as without batteries oversizing the solar-PV system is on average not helpful in case of sun-less days.
The result value is divided for each generation type (solar, wind) by the maximum average hourly supply load in kWh provided by 1 kW of capacity, localised for the particular camp from the hourly profile using the renewables ninja tool.
The end result of this procedure is the number of kW of solar-PV or wind power generation that is required to meet demand loads in aggregate. In case of households/family needs the total generation can be divided by the number of families to obtain per household capacity requirement.
In case of scenario’s where solar and/or wind generation is complemented with diesel generation, the diesel generation is scaled to meet the missing maximum load per hour. Thereby all demands can be met at all time.
In case of scenario’s of combined battery systems with centralised solar and/or wind generation the capacity of the battery systems is set equivalent to the generation capacity, and subsequently scaled by a factor 1.5 for community/institutional use, and a factor 2 for household/family use.
Battery capacity for household/families with solar-PV plus battery is based on the average evening time capacity requirement to meet demand from 18:00 plus additional hours (2 hours for the 2 hours of battery scenario until 20:00 4 hours for the 4 hour battery scenarios, and so forth).
2.4 Option Indicator calculations
2.4.1 Cooking – Indicators
The RERT tool v1 incorporates ten performance indicators for cooking solutions as presented in table 11, calculated for each of the 16 cooking solutions. The methodology on how they are calculated for each are discussed in this section by type of indicator: economic, environmental and health indicators.
Table 9. Indicators for Cooking Solutions
| No. | Scale | Indicators for Cooking Solutions | Unit |
|---|---|---|---|
| 1 | Camp | Investment cost for cooking interventions | Currency (as selected) |
| 2 | Camp | Total Monthly Cooking Fuel Cost | Currency (as selected) |
| 3 | Camp | Carbon Dioxide emissions per year | Tonnes |
| 4 | Camp | Annual area at risk from deforestation for woodfuel use | Km2 |
| 5 | Camp | Area used for providing woodfuel from plantations | Km2 |
| 6 | Household | Affordability of Cooking Fuel | Very low to Very High |
| 7 | Household | Monthly Cooking Fuel Cost | Currency (as selected) |
| 8 | Household | Cost of purchasing cooking stove | Currency (as selected) |
| 9 | Household | Carbon Dioxide emissions per family per year | Tonnes |
| 10 | Household | Health risk associated with cooking | Very low to Very High |
Cooking - Economic indicators
Generalised cookstove costings data including purchase cost, and fuel cost estimates and lifespan for 47 cookstoves are available from Vianello et al. (2016).[1] The approach incorporates location and currency specific data based on 2018 exchange rates, so as to make the calculations as localised as possible. The country and associated currency can be selected in the overview tab.
The investment cost for cooking interventions is based on the total cost of the cooking stoves for supplying these to all families in the camp as a one-off purchase. The monthly cooking fuel cost is based on the parameter for the price of fuel multiplied with the amount of fuel usage per month as estimated with user inputs, split out between households and total camp use for all families.
Affordability of cooking fuel is based on an estimate provided by the user of camp household incomes split into low income, medium income, and high-income households, and their % shares in the camp (for example, 70% low, 20% medium, 10% high income households), based on camp surveys or other estimates.
The user also needs to supply the average cost of a healthy food basket per month. Subsequently, the RERT tool calculates how much income would be left for each household type after subtracting the cost of food to the income level. Then it calculates what % of households would have sufficient income left to afford monthly cooking fuel based on remaining income, as an approximation of the affordability of cooking fuel.
Finally, the % share is categories among the very low to very high scale as follows:
Very low if less than 20% of households being able to afford cooking fuel.
Low if between 20% and 40% of households are able to afford cooking fuel.
Medium if between 40% and 60% of households are able to afford cooking fuel.
High if between 60% and 80% of households are able to afford cooking fuel.
Very high if more than 80% of households are able to afford cooking fuel.
Cooking Solutions - Air Pollution/Health indicators
The health risk from cooking solutions is a tiered indicator with five levels from very low, low, medium, high, to very high risks. The qualitative levels correspond to the IWA tiers for indoor-emissions (see Table 10 below). Each International Workshop Agreement (IWA) tier, as set by the clean cooking alliance, from 0 to 4 was utilised with 0 corresponding to very low and 4 corresponding to very high risks. Based on the statistical assessment using the database for cookstoves from the clean cooking alliance, and additional literature sources, as described in section 2, each of the 16 cookstove types in the tool were assessed on what their IWA tier level was ranked at based on the carbon monoxide emissions, and the fine particulate matter emissions, as these are directly related to health risks. As such, the RERT tool can identify how different cookstove solutions rank on IWA tiers, and thereby on the qualitative scaling from very low to very high risks.
Table 10. IWA Tiers for Cooking Solutions.
| IWA Tier | Thermal Efficiency (%) | Carbon Monoxide Emissions (gram/megajoule delivered) | Fine Particulate Matter Emissions (milligram/megajoule delivered) | Safety (score) | Durability (score) |
|---|---|---|---|---|---|
| 5 | \geq50 | \leq3.0 | \leq5 | \geq95 | <10 |
| 4 | \geq40 | \leq4.4 | \leq62 | \geq86 | <15 |
| 3 | \geq30 | \leq7.2 | \leq218 | \geq77 | <20 |
| 2 | \geq20 | \leq11.5 | \leq481 | \geq68 | <25 |
| 1 | \geq10 | \leq18.3 | \leq1031 | \geq60 | <35 |
| 0 | <10 | >18.3 | >1031 | <60 | >35 |
The approach provides for a robust simple means to categorise different stoves and assess their health risks in a transparent manner. A more detailed approach is the global burden of disease and exposure distribution method developed for Household Air Pollution (HAP).[30] An existing tool that includes this is the Household Air Pollution Intervention Tool (HAPIT).3
Cooking Solutions – Carbon Emissions indicators
The amount of carbon dioxide emissions E_{\text{ijk}}associated with cooking can be established based on a direct association of CO2 emissions, per unit of fuel consumed, as :
E_{\text{ijk}} = \ F_{\text{ijk}} \cdot \ \gamma_{\text{jk}} (13)
With \gamma_{\text{jk}} as a parameter to establish the carbon dioxide emissions in weight value per cookstove and fuel type weight that is burnt. Data for this parameter for 22 cookstoves with six fuel types was analysed by Jetter et al. (2012) as utilised in the tool.[31] The approach allows for calculating the carbon dioxide emissions per household/family and for the entire camp.
Cooking Solutions – Deforestation Risk indicators
The RERT tool includes two indicators related to biomass use and deforestation risk. The first, the annual area at risk from deforestation for woodfuel use, is estimated based on the calculated amount of woodfuel need either directly or from charcoal usage. The value is compared with the estimated biomass growth in tonne per km2 per year from different ecosystem types, including evergreen forest/rain forest, forest-savanna (Mosaic), deciduous forest, sparse forest (woodland), shrubland, and grassland/savannah. As such the total km2 that is at risk is provided as the amount of wood taken commensurate with the growth per year per km2. Values for tonnes per year were taken from [reference].
Second, the area used for providing woodfuel from plantations, based on the user inputs on whether either woodfuel or charcoal is provided by the camp management or other organisations sourcing from managed plantations. As well as the amount of woodfuel or charcoal is provided. It is assumed that the sourcing is based on eucalyptus plantations biomass growth per km2 per year, with a standard value from Ugande et al. (2001).[32] Thereby the total area used for providing plantation woodfuel is calculated, through estimating the amount supplied, and the area needed to grow this supply.
2.4.2 Household/Family Electricity & Lighting – Indicators
The RERT tool v1 incorporates 6 performance indicators for household/family lighting and electricity solutions as presented in table 11, calculated for each of the 11 solutions. The methodology on how they are calculated for each are discussed in this section by type of indicator: economic, availability, and environmental.
Table 11. indicators for Household Lighting and Electricity Solutions (decentralised)
| No. | Scale | Indicators for Cooking Solutions | Unit |
|---|---|---|---|
| 1 | Camp | Investment cost for household lighting and electricity | Currency (as selected) |
| 2 | Household | First three years Monthly total electricity cost including lighting per household with 3-year leasing of equipment | Currency (as selected) |
| 3 | Household | Affordability of Lighting and Electricity Options | Very low to very high |
| 4 | Household | Time availability of electricity and lighting (17:00 - 24:00) on average | Hours |
| 5 | Household | Time availability of electricity and lighting (24 hours) on average | Hours |
| 6 | Household | Lighting and Electricity Carbon Dioxide emissions per year | Tonnes |
Household/family lighting and electricity – Economic Indicators
The affordability indicators and investment cost indicators are calculated in a similar manner to the cooking solution indicators as described in section 5.1. In case of affordability, not the cooking solution cost, but the monthly electricity cost if the investment and operation for solar-PV and/or wind and/or batteries would need to be recouped over a three year period is selected based on dividing the investment costs over 3 years. This assumes that the equipment is leased to the households over a three year period.
In addition a new indicator is introduced that is related – First three years Monthly total electricity cost including lighting per household with 3-year leasing of equipment – which calculates the total monthly cost if the equipment would need to be fully costed by the household/family under a three year leasing scheme, based on i) the total investment cost divided into 36 portions covering 3 years x 12 months, the total operational and maintenance cost over a 12 month period, and any remaining diesel generation cost if diesel generators are part of the solution.
Household/family lighting and electricity – Availability indicators
The time availability indicators are based on comparing the demand and supply load profiles for electricity usage and how each technology solution provides or does not provide power during particular hours. Based on the comparison for each solution the availability from 17:00 to 24:00 is estimated, and that relative to a 24 hour period. As such the solutions that can provide as much evening time electricity (for cooking, lighting and other uses) and night-time electricity are ranked higher under these indicators.
Household/family lighting and electricity – Carbon Emissions indicators
The calculation is carried out in a similar fashion as the cooking solution carbon emission indicators, as described in section 5.1.
2.4.3 Household/Family Electricity & Lighting – Indicators
The RERT tool v1 incorporates 3 performance indicators for community/institutional electricity solutions as presented in table 12, calculated for each of the 12 solutions. The methodology on how they are calculated for each are discussed in this section by type of indicator: economic, and environmental.
Table 12. Indicators for Camp Lighting and Electricity Solutions (centralised)
| No. | Scale | Indicators for Camp Lighting and Electricity Solutions | Unit |
|---|---|---|---|
| 1 | Camp | Total lighting and electricity operational cost (max threshold) | Currency (as selected) |
| 2 | Camp | Total annual lighting and electricity Investment cost (max threshold) | Currency (as selected) |
| 3 | Camp | Total fuel combustion CO2 emissions per year (max threshold) | Tonnes |
Community/Institutional lighting and electricity – Economic Indicators
The investment cost and operational costs are standard indicators based on the aggregate investment cost for the 12 electricity supply solutions (e.g. combinations of solar-PV, wind energy, batteries, diesel generation), and estimated operational costs on an annual basis.
Household/family lighting and electricity – Carbon Emissions indicators
The calculation is carried out in a similar fashion as the cooking solution carbon emission indicators, as described in section 4.1.
2.5 Energy Access Tiers, Threshold Grouping & Ranking Calculations
Energy Access Tier Calculations
After electricity demands for the current baseline are established as per the calculations above, the current Energy Access Tiers are calculated (see ESMAP (2015)[33]. The ESMAP energy access tiers framework defines different Energy Access Tiers based on a series of tables/matrices. Five areas of energy access are considered for households/families: electricity services, lighting, cooking, heating, and street lighting.
The calculation in the RERT tool is carried out by comparison of the distribution of energy use technologies/infrastructures for each area, and the extent to which it matches with the first 3 tiers of energy access, using a set of if-then matching rule, based on pre-estimated qualities that indicate whether an option meets a particular tier. The if-then matching rules are defined at an abstract level as:
\ If\ for\ Energy\ option\ j\ service\ the\ service\ and\ availability\ is\ met\ for\ Tier\ X,\ \text{set\ the\ Energy\ Access\ Tier\ to\ X}\ for\ the\ \%\ of\ the\ population\ using\ option\ j.
After the current Energy Access Tiers are calculated, each potential technology solution can be compared against the current baseline situation. To this end each technology solution has been identified at which energy-access tier level it can be rated in a pre-defined way, by assessing the performance capabilities for that solution and how it fits with providing the related energy access tier. For example, a gasifier cooking stove using pellet supply is ranked at energy access tier 3 for cooking, given the limited time needed to acquire fuel (pellet fuel is sold or provided directly), the minor amount of stove preparation time in filling the stove and lighting it, less than 5 minutes, and the associated low PM and carbon monoxide emissions. The approach allows the RERT tool to identify which energy access tiers are associated with each solution, for comparison and selection purposes.
The energy access tiers are in the tool related to a user selection of which tier the solutions should attain, such that the three recommended options fit as closest as possible to the required tier improvement. The user to this end can select four options, Current Average Tier, Tier 1, Tier 2 or Tier 3 for the solution requirement (see Figure 6).
Figure 6. An overview of the interface where Energy Access Tier Requirements for the Technology Solutions are set by the user.
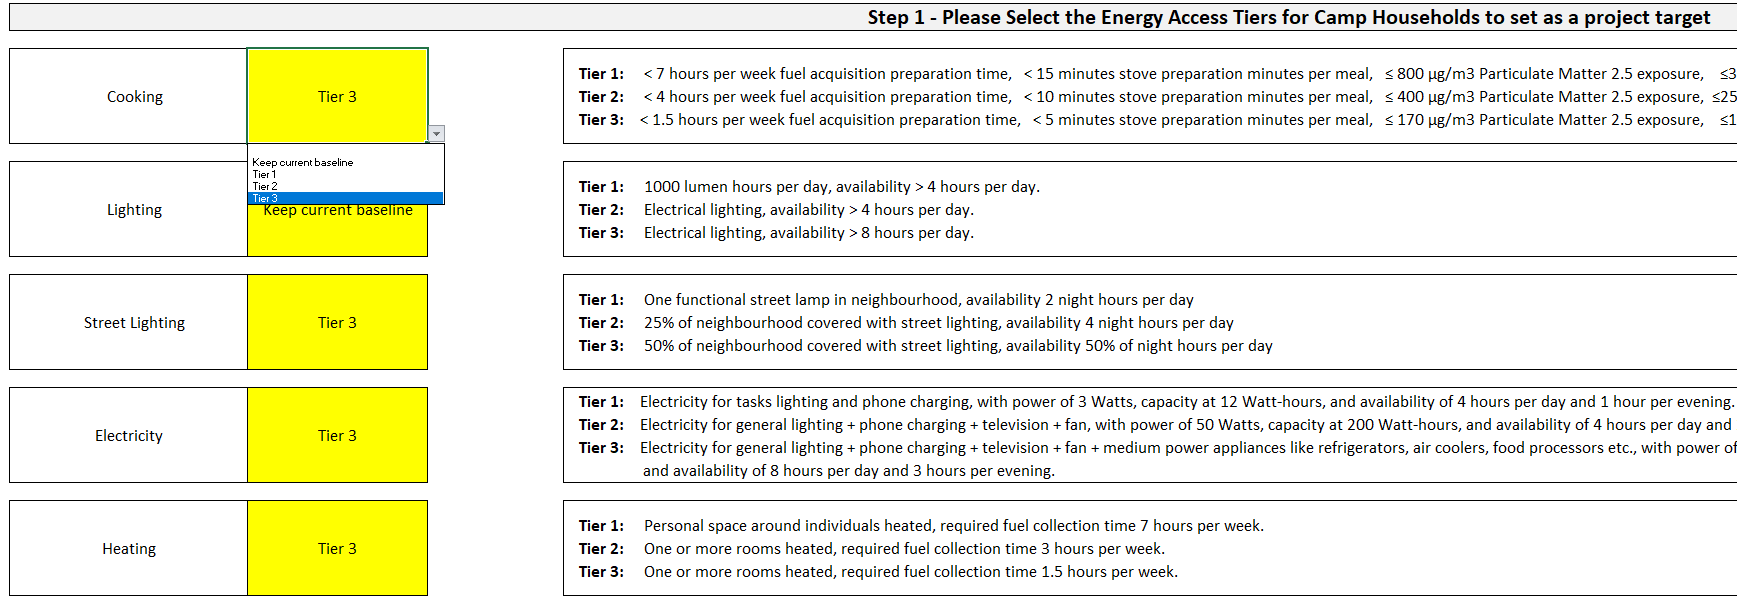
Table 13. Tiers of Household Energy Access based on ESMAP values. Source: ESMAP (2015)[33]
| Metric | Tier 1 | Tier 2 | Tier 3 | |
|---|---|---|---|---|
| Electricity | Services | Task lighting, phone charging | General lighting & phone charging & television & fan (if needed) | Tier 2 + ANY medium power appliances (refrigerator, air cooler, food processor, water pump, rice cooker). |
| Power | 3 Watts | 50 Watts | 200 Watts | |
| Capacity | 12 Wh | 200 Wh | 1 kWh | |
| Availability | 4 hours per day, 1 hour per evening | 4 hours per day, 2 hours per evening | 8 hours per day, 3 hours per evening | |
| Lighting | Service per person | 1000 lumen hours per day | Electrical lighting | Electrical lighting |
| Availability | >4 hours per day | >4 hours per day | >8 hours per day | |
| Cooking | Fuel acquisition preparation time | <7 hours per week | <3 hours per week | <1.5 hours per week |
| Stove preparation time | <15 minutes per meal | <10 minutes per meal | <5 minutes per meal | |
| PM2.5 Exposure (\mug/m3) | \leq800 | \leq400 | \leq170 | |
| CO Exposure (mg/m3) | \leq35 | \leq25 | \leq18 | |
| Health Risk* | Tentatively 60% higher long-term mortality than level 5 | Tentatively 45% higher long-term mortality than level 5 | Tentatively 30% higher long-term mortality than level 5 | |
| Heating | Capacity | Personal space around individuals heated | One or more rooms heated | One or more rooms heated |
| Convenience / fuel collection time | 7 hours per week | 3 hours per week | 1.5 hours per week |
*Health risk is relative to tier 5 which is the “lowest level above which total cardiopulmonary and lung cancer mortality increases in response to PM2.5
Table 14. Tiers of Community Energy Access based on ESMAP values. Source: ESMAP (2015).[33]
| Metric | Tier 1 | Tier 2 | Tier 3 | |
|---|---|---|---|---|
| Street lighting | Capacity | 1 functional street lamp in neighbourhood | 25% of neighbourhood covered | 50% of neighbourhood covered with street lights |
| Availability | 2 night hours / day | 4 night hours per day | 50% of night hours per day |
Calculating the three recommended options
The aim of the three recommended option process is to select the best scoring options within the user selected energy access tiers. To evaluate the three recommended options a two-step procedure is provided. First, the scoring of each technology solution across performance indicators is calculated. To do so a relative ranking is made for each technology option. In case there are 16 options therefore there will be a scoring of 1 to 16 points (16 the highest, 1 the lowest).
Note: The top 3 recommended options are not ranked or presented in any particular order, they are the three best performing options in relation to the scenario thresholds set by the user.
In mathematical terms the ranking can be described as having a number of options \j = 1,2,\ldots,n, with an integer value assigned based on the relative quantitative ranking between options. The best indicator scoring received the highest number, and the lowest indicator the lowest number. The total number of points that can be awarded in case of 16 options and ten performance criteria is therefore 160 points (16 x 10). See figure
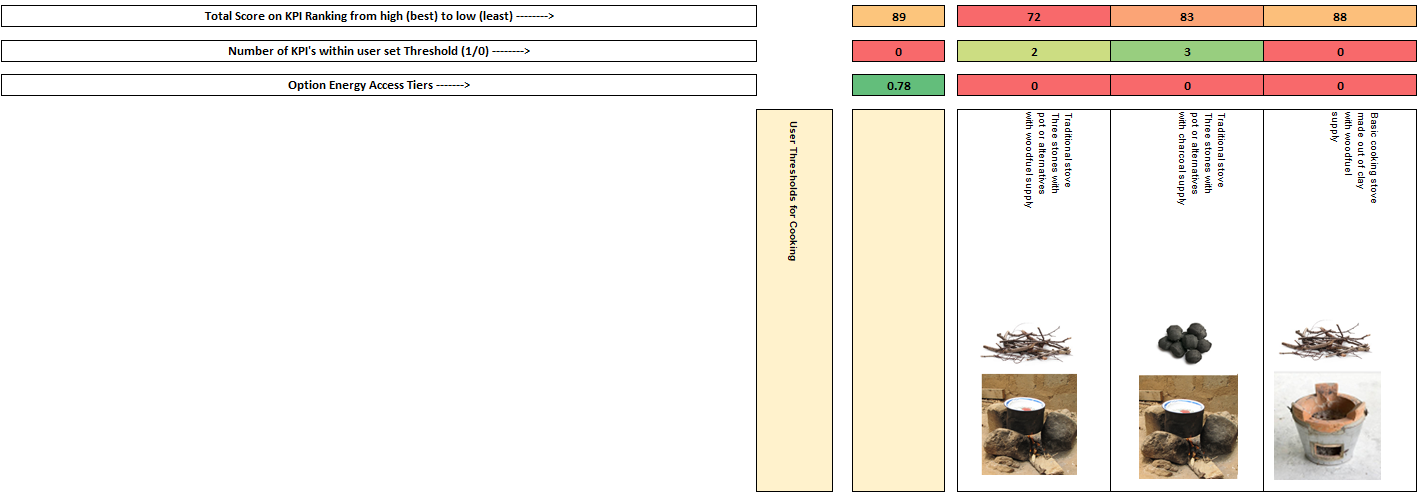
Figure 7. Scoring of different solutions visible to technical users
In case of qualitative indicators a ranking value R_{j} is assigned using a value assignment depending on the number of categories within the indicators, whereby:
\ R_{j} = \left\{ \begin{matrix} \frac{1}{8}\ \text{n\ \ \ }\text{if\ }\text{ranking\ is\ low\ \ \ \ \ \ \ \ } \\ \frac{4}{8}\text{n\ \ \ if\ }\text{ranking\ is\ medium} \\ \frac{7}{8}\text{n\ \ \ if\ }\text{ranking\ is\ high\ \ \ \ \ \ \ \ } \\ \end{matrix} \right. (14)
And
\ R_{j} = \left\{ \begin{matrix} \frac{2}{16}\ \text{n\ \ \ }\text{if\ }\text{ranking\ is\ very\ low\ \ \ \ \ \ \ \ } \\ \frac{5}{16}\ \text{n\ \ \ }\text{if\ }\text{ranking\ is\ low\ \ \ \ \ \ \ \ \ \ \ \ \ \ \ \ \ \ \ \ \ } \\ \frac{8}{16}\text{n\ \ \ if\ r}\text{anking\ is\ medium\ \ \ \ \ \ \ \ \ \ \ \ \ } \\ \frac{11}{16}\ \text{n\ \ \ }\text{if\ }\text{ranking\ is\ high\ \ \ \ \ \ \ \ \ \ \ \ \ \ \ \ \ \ \ } \\ \frac{14}{16}\text{n\ \ \ if\ r}\text{anking\ is\ very\ high\ \ \ \ \ \ \ \ \ \ } \\ \end{matrix} \right. (15)
Second, out of the ranking the options are selected that are at or closest to the Energy Access Tier that is selected by the user (1, 2, or 3). The best scoring options within the selected energy access tier are selected as the top three recommended solutions (see Figure 8 below). The total scoring is displayed as a ranking for each option alongside the results, so as to compare between options within the recommended group and the non-recommended group of options.
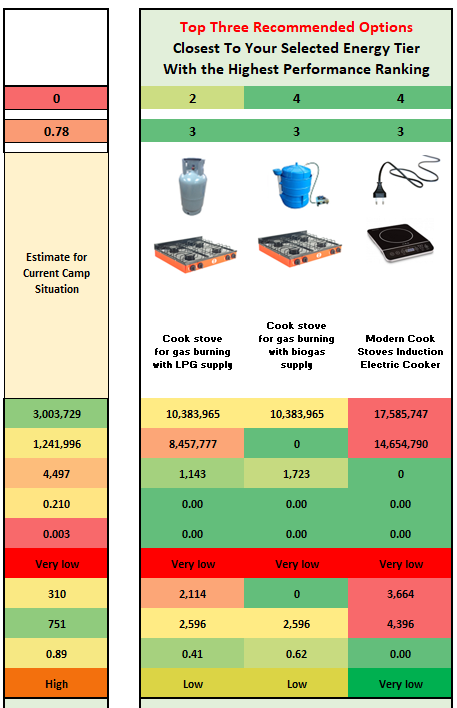
Figure 8. Top Three Recommended Options Result Example
Threshold Ranking per Option
In addition to selecting the energy access tiers and the ranking for option performance the user also can select a series of minimum or maximum thresholds for each performance indicator across cooking, household/family electricity & lighting, and/or community/institutional lighting. The threshold gives a scoring for a solution when it either surpasses or falls below an energy solution design criteria.
A scoring of 0 or 1 is assigned to each performance criteria, such that if there are 10 performance indicators like for cooking solutions, an individual solution can at maximum have a score of 10, and at minimum a score of 0. This allows for a ranking of how well each solution performs against each-other by user set criteria. Eeach indicator thus has an equal weight.
The process is similar for quantitative and qualitative indicators, given that qualitative indicators range from low to high, or from very low to very high. Thereby a bigger or lower than comparison can be made to establish which binary value to assign.
The ranking is displayed for each option so that the user can understand how well each option performance based on the design needs. The ranking provides a similar solution idea to the more precise performance ranking as explained above. And helps users understand how well the options fit within their specific camp solution needs.
2.6 References
[1] Vianello, M. A Review of Cooking Systems for Humanitarian Settings. Mov. Energy Initiat. May (2016).
[2] Corbyn, D. & Vianello, M. Prices , Products and Priorities Meeting Refugees ’ Energy Needs. January 74 pages (2018).
[3] Barbieri, J., Riva, F. & Colombo, E. Cooking in refugee camps and informal settlements: A review of available technologies and impacts on the socio-economic and environmental perspective. Sustain. Energy Technol. Assessments 22, (2017).
[4] Still, D., Bentson, S. & Li, H. Results of Laboratory Testing of 15 Cookstove Designs in Accordance with the ISO/IWA Tiers of Performance. Ecohealth 12, 1 (2015).
[5] MacCarty, N., Still, D. & Ogle, D. Fuel use and emissions performance of fifty cooking stoves in the laboratory and related benchmarks of performance. Energy Sustain. Dev. 14, 3 (2010).
[6] Johnson, M. A. & Chiang, R. A. Quantitative guidance for stove usage and performance to achieve health and environmental targets. Environ. Health Perspect. 123, 8 (2015).
[7] Ruiz-Mercado, I., Canuz, E. & Smith, K. R. Temperature dataloggers as stove use monitors (SUMs): Field methods and signal analysis. Biomass Bioenergy 47, (2012).
[8] Bentson, S., Still, D., Thompson, R. & Grabow, K. The influence of initial fuel load on Fuel to Cook for batch loaded charcoal cookstoves. Energy Sustain. Dev. 17, 2 (2013).
[9] Pillarisetti, A. et al. Patterns of stove usage after introduction of an advanced cookstove: The long-term application of household sensors. Environ. Sci. Technol. 48, 24 (2014).
[10] Business Innovation Facility. Off-grid lighting and phone charging study A snapshot of household technologies, habits and expenditure in Malawi. August (2016).
[11] Mills, E., Tracy, J. L., Alstone, P., Jacobson, A. & Avato, P. Low-cost LED flashlights and market spoiling in Kenya’s off-grid lighting market. Energy Effic. 8, 2 (2015).
[12] Mills, E. Technical and economic performance analysis of kerosene lamps and alternative approaches to illumination in developing countries. Lawrence Berkeley Natl. Lab. (2003).
[13] Grimm, M., Anicet, M., Jorg, P. & Maximiliane, S. A First Step up the Energy Ladder? Low Cost Solar Kits and Household’s Welfare in Rural Rwanda. (2014).
[14] Maina, S. Africa’s Most Popular Smartphones Show a Budding Love for Budget Devices. Techweez (2017). Available at: http://techweez.com/2017/09/08/africa-most-common-smartphones/.
[15] Stojanovski, O., Thurber, M. & Wolak, F. Rural energy access through solar home systems: Use patterns and opportunities for improvement. Energy Sustain. Dev. 37, (2017).
[16] Phadke, A. A. et al. Powering a Home with Just 25 Watts of Solar PV. Super-Efficient Appliances Can Enable Expanded Off-Grid Energy Service Using Small Solar Power Systems. (2015). doi:10.2172/1229861
[17] GIZ. Photovoltaics for Productive Use Applications. 252 pages (2016).
[18] Global Leap, Energy, C. & Dalberg. The State of the Global Off-Grid Appliance Market. 37 pages (2017).
[19] Hartvigsson, E. & Ahlgren, E. O. Comparison of load profiles in a mini-grid: Assessment of performance metrics using measured and interview-based data. Energy Sustain. Dev. 43, (2018).
[20] Blodgett, C., Dauenhauer, P., Louie, H. & Kickham, L. Accuracy of energy-use surveys in predicting rural mini-grid user consumption. Energy Sustain. Dev. 41, (2017).
[21] Shehaded, N. H. Sustainable Street Lighting: A Guide to Efficient Public Street Lighting for Lebanon APublication. 57 pages (2015).
[22] Atalla, T., Gualdi, S. & Lanza, A. A global degree days database for energy-related applications. Energy 143, April (2018).
[23] Sarak, H. & Satman, A. The degree-day method to estimate the residential heating natural gas consumption in Turkey: A case study. Energy 28, 9 (2003).
[24] Lamptey, F. Determination of domestic water consumption pattern in Accra. (2010).
[25] Cronin, A. A. et al. A review of water and sanitation provision in refugee camps in association with selected health and nutrition indicators – the need for integrated service provision. J. Water Health 6, (2008).
[26] Shrestha, D. & Cronin, A. A. The right to water and protecting refugees. Waterlines 24, 3 (2006).
[27] Fraenkel, P. & Thake, J. Water Lifting Devices: A Handbook. . FAO and Intermediate Technological Publications 337 pages (2006).
[28] Conlon, T. & Weisbrod, G. We ’ ve Been Testing Water Pumps For Years- Has Their Efficiency Changed ? 583–594 pages (1996).
[29] Kis, Z., Pandya, N. & Koppelaar, R. H. E. M. Electricity generation technologies: Comparison of materials use, energy return on investment, jobs creation and CO2emissions reduction. Energy Policy 120, October 2017 (2018).
[30] Burnett, R. T. et al. An integrated risk function for estimating the global burden of disease attributable to ambient fine particulate matter exposure. Environ. Health Perspect. 122, 4 (2014).
[31] Jetter, J. et al. Pollutant emissions and energy efficiency under controlled conditions for household biomass cookstoves and implications for metrics useful in setting international test standards. Environ. Sci. Technol. 46, 19 (2012).
[32] Ugalde, L., Perez, O. & Mead, D. J. Forest Plantations Thematic Papers: Mean Annual Volume Increment of Selected Industrial Forest Plantation Species. 27 pages (2001). doi:10.1017/S0020818300006160
[33] Bhatia, M. & Angelou, N. BEYOND CONNECTIONS Energy Access Redefined. 244 pages (2015).
Humanitarian Engineering for Energy for Displacement (HEED)
Funded by the ESPRC Global Challenges Research Fund
Renewable Energy Recommendations Tool (RERT)
======= # Use Case: Kigeme Camp Rwanda Cooking Solutions Evaluation
Authors: Sandy Robinson (Scene), Rembrandt Koppelaar (Scene)
v.2.0 10th October 2019
======= ## Overview
This document supports the Renewable Energy Recommendations Tool (RERT) produced as part of the Humanitarian Energy and Engineering for Development (HEED) research project. It provides a use case scenario to guide RERT users through the process of using the tool. The use case is particular to the assessment and recommendation of cook stove interventions at Kigeme Camp, Rwanda, and was undertaken in June 2019. When seeking to use the RERT, it is recommended that this case study is read in conjunction with the RERT User Guide.
About Humanitarian Energy and Engineering for Development (HEED)
The HEED project is an innovative response to growing recognition of the need to improve access to energy, particularly renewable energy sources, for populations displaced by conflict and natural disasters. The focus of HEED is on the lived experiences in three refugee camps in Rwanda (Nyabiheke, Gihembe and Kigeme) and internally displaced persons (IDPs) forced to leave their homes as a result of the 2015 earthquake in Nepal.
Renewable Energy Recommendations Tool (RERT)
The RERT was built by Scene Connect with support from Coventry University and Practical Action between June 2018 and April 2019. It aims to provide technology recommendations based on 23 performance indicators to increase energy access in refugee camps and improve sustainability for:
Cooking Energy;
Household Lighting and Electricity;
Community/Camp central Lighting and Electricity.
Users engage with an Excel spreadsheet where they answer questions to describe the population of the camp and the social and economic situation, as well as the camp energy infrastructure and energy use of families therein. They can also enter technical data for particular renewable energy options.
2.7 Use Case Scenario
The purpose of providing a use case scenario is to give tool users a practical guide through a real-world example of using the tool in a humanitarian setting. The following evaluation details how to:
Input data on current cookstove utilisation in Kigeme, Rwanda;
Interpret baseline energy use outcomes from the tool, including economic and environmental analyses;
Define what level of energy access has been achieved, based on the ESMAP multi-tier energy access matrices;
Understand tool recommendations for cookstove interventions in a specific context;
Set boundary criteria and alter specific parameters of the tool.
A special focus included to provide an understanding of which solutions could provide significant climate change carbon emission impacts reductions, as part of the improvements that could be achieved with shifts to better cooking solutions.
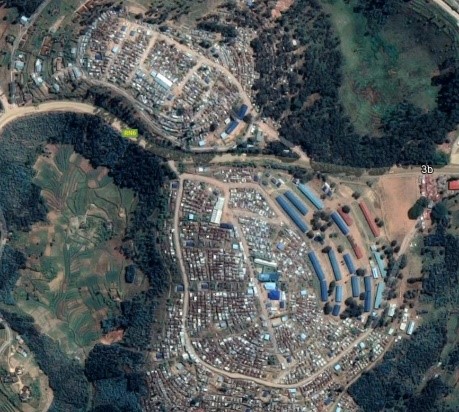
Kigeme Refugee Camp
The Kigeme displaced people camp in Rwanda was setup in 2012 to address the influx of Congolese refugees into the country. As of early 2019 there are close to 21,000 residents and over 4,000 families living in the camp. The camp is situated in Nyamagabe district in South-West Rwanda, to the east of Nyungwe Forest National Park (see Figure 1). The area is hilly with land uses including forests, agriculture and host community settlements.
A number of programmes have been recently conducted in Kigeme, making it a particularly interesting use case in respect to cooking interventions. Alongside a cash assistance programme, which replace the provision of food and in-kind support with mobile phone accessible cash transfers, a number of new energy schemes have been deployed. This includes the introduction of an innovative cooking fuel solution which gives refugees the option to buy clean fuel (pellets) for use in improved cooking stoves with their cash allowances.
The improved cook stove solution scheme is being delivered in the camp by a Rwandan private sector social enterprise, Inyenyeri, who produce environmentally sustainable fuel burning pellets and lease clean and highly efficient cook stoves to residents.
Data utilised in this use case was collected using existing data sources and via an integrated questionnaire deployed in Kigeme camp in 2018/19. Data was provided / collected by the HEED project team, with the support of UN humanitarian staff, Kigeme camp authorities and humanitarian energy researchers.

=======
2.8 Use Case methodology
This methodology is provided to guide users through using the RERT with real-world data and application to Kigeme Refugee Camp, Rwanda. The aim of this use case is to understand the current (2019) cooking situation in Kigeme Camp and provide projections for viable cookstove interventions and their potential impacts.
2.8.1 Stage 1: Baseline Data
Baseline data was sourced and inserted into the RERT (see Figure 2), including:
Camp Population: 21,000
No. of families in camp: 4,000
Percentage share of households operating a business: 8%
Landscape around the camp: Evergreen Forest / Rainforest
======= 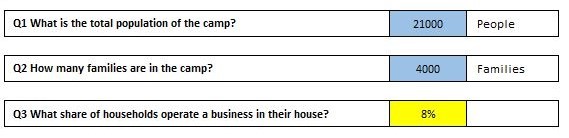
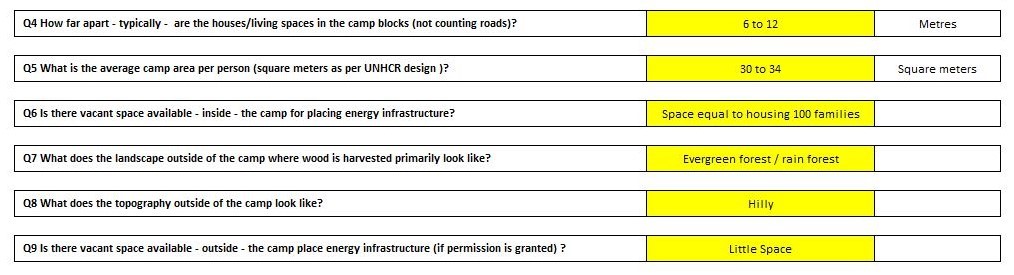
Figure 2 - Setting Baseline Data
The baseline cooking situation was estimated with the RERT using an integrated questionnaire approach (see Figure 3). The cooking modes primarily utilised in the camp include:
Three stone pot cookstoves or similar traditional devices using wood fuel (“Basic cookstoves”): 4 out of 10 families
Cookstove made with fired clay (ceramic) with a metal holder using charcoal or briquette fuel (“Fired clay cookstoves): 2 out of 10 families
Cookstove made for burning wood pellets (“Inyenyeri mimi-moto stove”) using wood pellets: 4 out of 10 families
Further to this, the type and usage of fuels were estimated, including:
Basic cookstove: Firewood - 9 out of 10 families / Charcoal - 1 out of 10 families
Fired clay cookstove: Firewood - 6 out of 10 families / Charcoal - 4 out of 10 families
Inyenyeri mimi-moto stove: Wood pellet - 10 out of 10 families
Finally, baseline income values, distribution and in-kind provision by camp authorities was set, including:
Low Income bracket: 23,600 RWF / month (US$26) (70% of camp population)
Medium Income bracket: 61,000 RWF / month (US$66) (20% of camp population)
High income bracket: 165,000 RWF / month (US$178) (10% of camp population)
Further to this a number of further variables are taken into account, including: monthly food cost per household; camp fuel provision and / or subsidisation; fuel production methods.
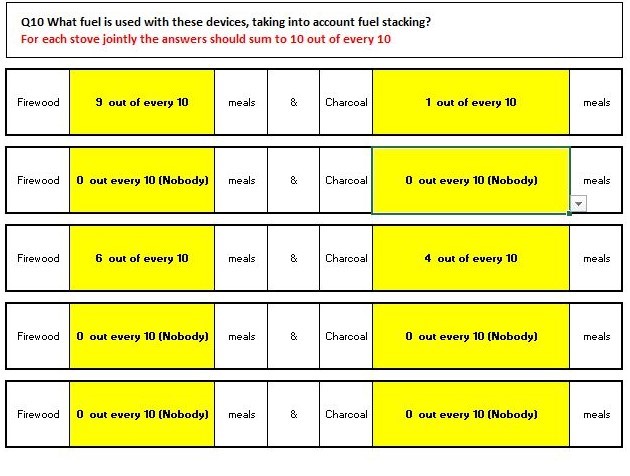
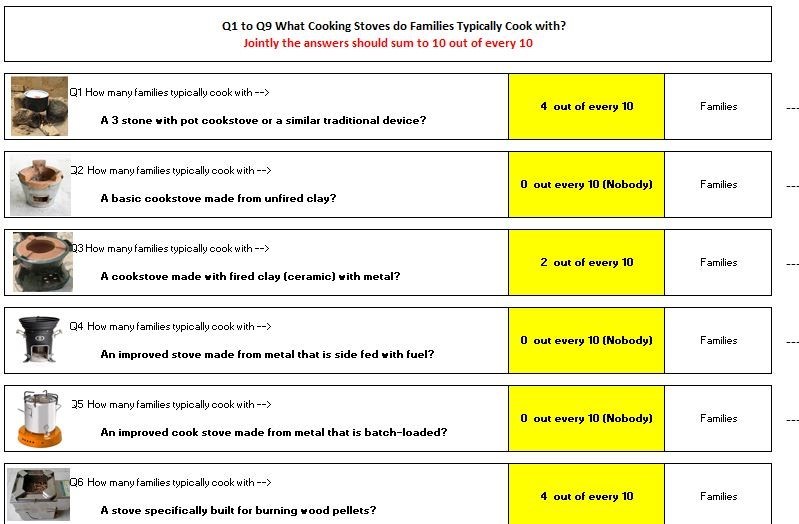
Figure 3 - Setting baseline cookstove use
2.8.2 Stage 2: Baseline Result
The evaluation of the current state of cooking covered, ten baseline performance indicators are output by the model, of which the results are shown in Table 1 below in the column headed ‘Current Situation’. An aggregate energy access indicator for cooking for the camp is also shown.
Energy access is estimated by looking at the tier level - from 0 to 5 - for each cooking stove and fuel and their utilisation and generate an average value. The result for the entire camp is an energy access level of 1.6 for cooking solutions, given the prominence of burning wood pellet stoves that are already in use.
In terms of current cooking stove performance results, the monthly total fuel expenditure was estimated at close to 1.6 million RWF, versus a capital cost of 5.5 million RWF in case all current cookstoves would need to be replaced (asset value of the cookstoves used). Current annual CO2 emissions for the camp were evaluated at 6,475 tonnes for cooking which comes down to 1.33 tonnes per year per family. The utilisation of wood-fuel without provisioning of such fuels in a sustainable manner is evaluated by RERT to be associated with a forest area of 0.24 km2 that is at annual risk of deforestation, given biomass needs to supply cooking fuels for all the 4,000 families in the camp. Finally, health risks due to stove usage are still high given the prominence of three stone post cookstoves, and to a lesser extent fired clay (ceramic) stoves.
2.8.3 Stage 3: Energy Intervention Recommendations
Recommendations are provided, based on the input baseline data and parameters relating to the cost, performance (capacity & utilisation), energy efficiency, fuel type and efficiency, emissions and energy tier. Sixteen different cooking solutions are evaluated based on the current stove and fuel options in the tool, with the three most viable options recommended. All recommendations are considered against the baseline results and displayed comparatively with all economic, social and environmental variables.
For Kigeme refugee camp, the top three best all round recommended options – based on their performance across ten indicators was quantified as listed in table 1 below – are listed below.
======= | | | ———————————————————— | | Gasifier stove for burning pellets: equivalent to the existing Inyenyeri mimi-moto stove that has been provided to 4 out of 10 families to date. |
Cookstove for gas burning with biogas supply: not in use in the camp |
The results given by the model are determined by the thresholds set by the user, which put stronger or weaker emphasis on particular aspects of energy supply, e.g. cost, carbon emissions, etc. In this case these stoves are recommended above all other stoves due to their combined benefits including:
40%-80% carbon emission savings;
over 25% operational fuel cost reductions;
and a strong reduction in health risks from on average High to Low or Very Low.
In addition, all three recommended options strongly reduce or bring to zero any deforestation risks. And all three raise the energy access level of families in the camp from the current average 1.6 to a level of 3.
Whilst offering many benefits, all recommendations have an investment cost of between 2 to 3 times that of the current situation. The tool thus allows decision makers to assess acceptable costs directly alongside potential social and environmental impacts. Also notable is that the cost of purchasing the recommended cookstoves is at least twice as expensive as the current situation, meaning decision makers must factor in these costs into any business case or subsidy support scheme.
| Indicator | Unit | Current Situation | Gasifier Stove for burning pellets with pellet supply | Cookstove for liquid fuel combustion with ethanol supply | Cookstove for gas burning with biogas supply |
|---|---|---|---|---|---|
| Camp - Investment cost for cooking interventions | Franc (RWF) | 5,523,926 | 12,992,936 | 15,340,048 | 10,394,349 |
| Camp - Total Cooking Fuel Cost | Franc (RWF) | 1,574,164 | 809,901 | 1,180,563 | 0 |
| Camp - Carbon Dioxide emissions per year | Tonnes | 6,475 | 3,869 | 1,504 | 2,464 |
| Camp – Annual area at risk from deforestation for wood fuel use | Km2 | 0.216 | 0.00 | 0.00 | 0.00 |
| Camp - Area used for providing wood fuel from plantations | Km2 | 0.036 | 0.04 | 0.00 | 0.00 |
| Household - Affordability of Cooking Fuel | Very low to Very High | Very low | Very low | Very low | Very low |
| Household - Monthly Cooking Fuel Cost | Franc (RWF) | 393 | 202 | 295 | 0 |
| Household - Cost of purchasing cooking stove | Franc (RWF) | 1,380 | 3,245 | 3,831 | 2,596 |
| Household - Carbon Dioxide emissions per family per year | Tonnes | 1.90 | 0.97 | 0.38 | 0.62 |
| Household - Health risk associated with cooking | Very low to Very High | High | Low | Very low | Low |
Table 1: Overview of the performance of the top three recommended cooking stove solutions
2.8.4 Stage 4: Recommendation Scenarios & Parameters
Though not utilised within the Kigeme use case, the RERT offers the ability to set recommendation scenarios, where specific criteria or thresholds may be set for the recommendation system. This may include setting a maximum capital cost level limit, emission target or affordability criteria. Further to this adjustment may be made to the data parameters to fit particular use contexts, such as a specific cook stove product.
Setting Recommendation Scenarios A number of criteria may be set in the model to act as upper limits to the tool’s recommendations system. This includes setting specific limits on:
- (Technology) Energy Access Tier (1 – 3)
- (Camp) Investment cost for cooking interventions
- (Camp) Total Cooking Fuel Cost per Month
- (Camp) Carbon Dioxide emissions per year
- (Camp) Annual area deforested for wood fuel use
- (Camp) Area used for providing wood fuel from plantations
- (Household) Affordability of Cooking Fuel
- (Household) Monthly Cooking Fuel Cost
- (Household) Cost of purchasing cooking stove
- (Household) Carbon Dioxide emissions per family per year
- (Household) Health risk associated with cooking
When set, the RERT will not recommend any interventions / technologies which breach these scenario limits.
Adjusting Data Parameters The RERT uses standardised parameters for all technologies and analyses carried out during the recommendation process. These may be adapted by for more in-depth analysis, such as particular cookstove models or brands.
Cookstove variables include: Stove Type; Fuel; IWA efficiency tier; efficiency; IWA indoor missions Tie; Indoor emissions CO (g/min); Indoor emissions PM2.5 (mg/min); Capacity (kW); utilisation rate; Average daily stove use (hours). Other variables include: Energy fuel content (MJ/kg); Charcoal generation efficiency (%); Fuel emissions data (tCO2e per t/fuel); Forestry density (t/km2); Wood fuel plantation density (t/m3); Camp centre wood fuel variables.
=======
2.9 Kigeme Use Case Conclusions
The use case detailed above shows how the use case can be utilised, with a working example of data input and analysis. The recommendations for Kigeme Refugee Camp show that energy interventions may offer a host of benefits including health and environmental impacts.
The RERT evaluation shows that:
The current cook stove situation has negative health and environmental impacts on cookstove users and the wider camp environment at present;
The introduction of pellet gasifier stoves has begun to reduce these negative health and environmental impacts, though further deployment / uptake would be beneficial;
With a relatively small investment (around 10,000 to 15,000 US Dollars), that pays itself back due to fuel cost reductions in about 15 years, substantial improvements for the families in the camp can be made in terms of livelihoods and environmental gains;
The current programme to provide families with pellet gasifier stoves (mimi-moto) with a plantation sourced pellet supply chain is one of the best approaches to follow in the context of Kigeme, Rwanda.
=======
2.10 Discussion
Simple and accessible input of data and output information is the core focus of RERT, including those with expert knowledge of humanitarian energy and those without. With humanitarian energy increasingly a focus of organisations in the humanitarian sector, the tool will hopefully provide a first means of conducting energy assessments in refugee camps and similar settings.
The RERT provides added value as a high-level assessment tool, enabling selection of technologies / interventions which will have the greatest impacts within a particular humanitarian context. Importantly, the tool is accessible to anyone with basic experience with Excel and data input, whilst offering more advanced data modelling capabilities for those with specialist expertise. This means the tool can provide non-technical stakeholders with the means to conduct an energy assessment, as well as technical users with the ability to conduct more detailed pre-feasibility assessments using more advanced functionality.
The RERT is considered most suitable for “non-emergency” humanitarian situations, including:
Recently established refugee camps (after 6 months – 1 year) to assess early options for energy infrastructure improvements;
Long running camps (over 1 year) to address existing camp energy infrastructure and design long-term, economically viable and impactful energy interventions;
Within aggregate humanitarian settings (e.g. IDP within a specific area but not considered a refugee camp) or within host community settlements.
It is expected that the RERT will be used by a number of humanitarian stakeholders, including: Intergovernmental organisations (e.g. regional UNHCR offices / Camp specific energy & environment officers); Camp authorities; 3rd sector humanitarian organisations; humanitarian research bodies / projects; in-camp energy technology / service providers.
Though initial effectiveness of the RERT has been assessed and, to some extent, proven via the Kigeme use case described above, as well as similar analyses conducted within the HEED project. Further investigation of how the tool performs must be conducted both geographically and temporally. In particular, long-term testing of the tool over 6 – 12 months is critical to understanding how the recommendations provided are reflected in real world interventions.
Humanitarian Engineering for Energy for Displacement (HEED)
Funded by the ESPRC Global Challenges Research Fund
Renewable Energy Recommendations Tool (RERT)
3 Use Case: Kebri Beyah Refugee Camp, Ethiopia
Cooking & Electricity Solutions
Authors: Sandy Robinson (Scene), Megan Lancaster (Mercy Corps), Cecilia Ragazzi (Mercy Corps)
v.1.2 1st October 2020
3.1 Overview
This document supports the Renewable Energy Recommendations Tool (RERT) produced as part of the Humanitarian Energy and Engineering for Development (HEED) research project. It provides a use case scenario to guide RERT users through the process of using the tool. The use case is particular to the assessment and recommendation of energy access at Kebri Beyah Refugee Camp, Ethiopia undertaken by Mercy Corps up to February 2020.
The purpose of this document is to provide a comparative assessment of the RERT against a parallel in-camp assessment at Kebri Beyah Refugee Camp, conducted by Mercy Corp.
About Humanitarian Energy and Engineering for Development (HEED)
The HEED project is an innovative response to growing recognition of the need to improve access to energy, particularly renewable energy sources, for populations displaced by conflict and natural disasters. The focus of HEED is on the lived experiences in three refugee camps in Rwanda (Nyabiheke, Gihembe and Kigeme) and internally displaced persons (IDPs) forced to leave their homes as a result of the 2015 earthquake in Nepal.
Renewable Energy Recommendations Tool (RERT)
The RERT was built by Scene Connect with support from Coventry University and Practical Action between June 2018 and April 2019. It aims to provide technology recommendations based on 23 performance indicators to increase energy access in refugee camps and improve sustainability for:
Cooking Energy;
Household Lighting and Electricity;
Community/Camp central Lighting and Electricity.
Users engage with an Excel spreadsheet where they answer questions to describe the population of the camp and the social and economic situation, as well as the camp energy infrastructure and energy use of families therein. They can also enter technical data for particular renewable energy options.
3.2 Use Case Scenario
The purpose of providing a use case scenario is to give tool users a practical guide through a real-world example of using the tool in a humanitarian setting. The following evaluation details how to:
Input data on current energy utilisation in Kebri Beyah, Ethiopia;
Interpret baseline energy use outcomes from the tool, including economic and environmental analyses;
Define what level of energy access has been achieved, based on the ESMAP multi-tier energy access matrices;
Understand tool recommendations for cookstove interventions in a specific context;
Set boundary criteria and alter specific parameters of the tool.
Compare tool outputs with survey analysis and recommendations made by in-country consultants.
A special focus of this case provide an understanding of how the RERT compares to real-world feasibility assessments for energy interventions, where the RERT tool is best suited in the assessment process, the limitations of the tool and potential improvements which would benefit the tool in future.
3.2.1 Mercy Corps
Mercy Corps is a global team of humanitarians, working together on current crises across more than 40 countries around the world. Through 6,000 staff members Mercy Corps works directly with people living through poverty, disaster, violent conflict and the acute impacts of climate change. Mercy Corps has been working in Ethiopia since 2004. Ethiopia is Africa’s second-most populous nation, and although the economy has been steadily growing, the vast majority of Ethiopia remains impoverished. More than 83 percent of the population lives in rural areas vulnerable to droughts caused by climate change as well as economic instability and conflict spill over from neighbouring Somalia and South Sudan.
Methodology
In February 2020, Mercy Corp conducted on the ground energy assessments across three refugee camps in the Jijiga district of Ethiopia. The assessments are based on surveys of 413 households, focus group discussions and key informant interviews within the camps to understand energy access and needs, alongside a technical assessment of electrical loads and cooking patterns within the camps. The purpose of the assessment was to define current energy access and use, towards defining the viability and cost of future energy interventions in the camps. This included assessment of solar home systems, microgrids and improved cooking solutions, as well as financing and enabling mechanisms for implementation of interventions.
The survey and interview questions prepared were to collect the data from the refugee camps and host communities in terms of energy access – delivery methods, quality of supply where it exists, expenses incurred and aspirational loads. The questionnaire sought information based on various elements that influenced refugee living conditions and in specific access to reliable energy. They are: Geography, Demography, Economic conditions, Living conditions, Access to cooking fuel, Livestock condition, Access to electricity, Water accessibility and Health
Random systematic sampling methods were used to extrapolate survey results to camp populations (see table). Further to this, technical assessments were conducted in line with ESPMAP-MTF, including smart digital clamp-meter / multi-meter systems to collect electrical demand data and portable weighing scales for cooking fuel measurements. Key Informant Interviews (KII) included UNHCR, Government of Ethiopia (GoE), Ethiopian Electric Utility, INGOs, Service Providers (Market research), Financing Agencies. Focused Group Discussions (FGDs) were held with 3 different groups - a Women’s Group, Men’s Group, Youth Group (<=18yrs).
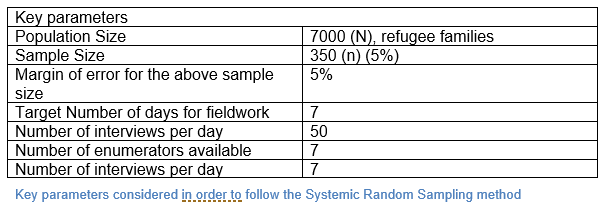
When inputting into the RERT, the data obtained from the above methods was reformatted into an appropriate measure for the tool. Percentage values from the sample were used to populate cooking and electrical appliance fields (e.g. number of camp residents out of 10 using three-stone cooking fires). Income bands were based on UNHCR data on median camp income, combined with the results of the surveying process.
3.2.2 Kebri Beyah Refugee Camp
Ethiopia is a country with a history of hosting refugees and has been maintaining an open-door asylum policy of giving humanitarian access and protection to the neediest. Ethiopia hosts 800,000 refugees and most are accommodated in 26 refugee camps with limited services and opportunities and depend largely on humanitarian assistance. Almost 99% of the fleeing communities are from its neighbours – Somalia, Sudan, South Sudan and Eritrea.
The Somali region is the poorest and most conflict-affected region of Ethiopia. The Human Development Index (HDI) score is the lowest in Somali. The Somali region hosts the largest refugees in Fafan zone. The three camps in the Jigjiga district are in the north eastern part of Ethiopia, bordering Somalia, comprising of three different refugee camps with a total refugee population of 36,916.
The Kebri Beyah camp was established in 1991 for Somali refugees fleeing the civil war in their country and currently has a population of 14,685 displaced people. The camp is not organized, and the refugee housing is mixed with that of the host community. In the satellite image below (see Figure 1), the refugee settlement is demarcated in orange, with the host community adjacent. In Kebri Beyah, the administrating offices of the agencies are not located in the same area of the camp except for those of the ARRA and UNHCR. While both offices have grid connectivity, it is not reliable and outages of 4-8 hours every day are a common feature. Since the refugee HHs are located along with those of the host communities, individuals of the host community extend their grid lines and provide electricity supply for a fee. A separate kitchen area is marked within the premises, Households cook using a three stone fire or the traditional charcoal stove.
Further information relating to Kebri Beyah, including contextual camp data used within this assessment can be found on the UNHCR website.
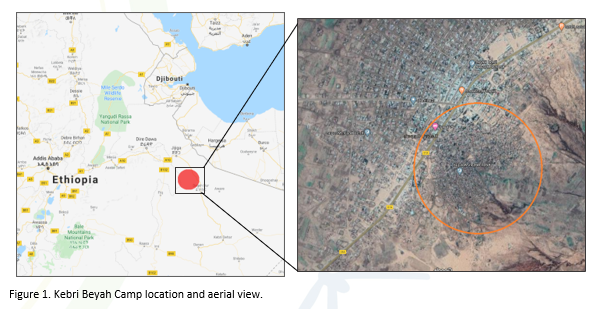
3.3 Cooking Analysis & Results
This section provides an overview of the current cooking situation in Kebri Beyah (i.e. the baseline situation), detailing the processes involved in using the RERT and the recommendations provided by the tool.
3.3.1 Baseline Situation
The baseline cooking situation in Kebri Beyah is between tier 0 – 1 in terms of energy access, with most of camp residents surveyed1 using firewood or charcoal in basic 3-stone fires (23%), charcoal stoves (16%) and Tikili charcoal stoves2 ) (7%). A further 4% of residents used kerosene stoves for cooking. The average cost of fuel within the study sample was 310 ETB/week. Residents were found to be aspirational towards use of Charcoal Tikikil, kerosene or ethanol stoves and few respondents highlighted electric stoves as an aspiration.
Using these metrics, the RERT tool was input with the baseline information shown in table 1. The study considered several key decision-making criteria to ensure that the scenario ambitions remained reasonable, including:
- Energy access tier 2, in line with camp resident ambitions;
- Rational total investment cost (101,710 ETB);
- Affordability of cooking fuel at camp level and household level;
- Targeting improvements in emissions and health.
The scenario criteria detailed below is an attempt to balance these aims, whilst achieving a marked improvement in camp-wide cooking improvements. It is worth noting that high household costs for purchase of tier 2 stoves and fuel would likely require funding from the camp authority or external stakeholders.
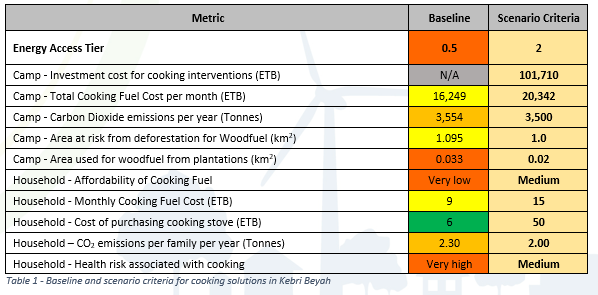
1 Sample size of 138 (household surveys)
2 http://catalog.cleancookstoves.org/stoves/170
3.3.2 Cooking Recommendations
Based on the above criteria, the below recommendations were provided by the RERT. To achieve energy access tier 2, fired clay wood / charcoal stoves or, with significantly more investment, improved wood fuel stoves are recommended.
Implementation of both fired clay (Woodfuel) and fired clay (charcoal) stoves would improve energy access tier (0.5 - > 2), reduce monthly cooking costs (50 - 60% across the camp), reduce carbon emissions (50 – 60%), reduce deforestation risks, reduce monthly costs of fuel at the household level (30 - 45%), reduce household CO2 emissions (55 – 70%) and reduce associated health risks (very high -> high).
Whilst improved cookstoves are potentially more impactful that fired clay cookstoves, the high investment costs, low household affordability and negligible additional benefits mean it is a less recommended intervention by the RERT. The implementation of improved cookstoves would be dependent on the final product specification and support (i.e. funding, grants) available for implementation.
It is worth noting that within the bounds of the scenario criteria (table 1), the tool could not find technology interventions which would fulfil all criteria. An example of this is the inability to meet the medium health risk criteria within the bounds of the wider scenario criteria.
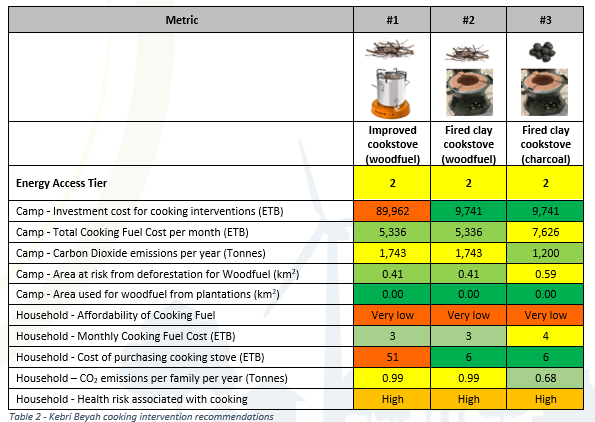
3.4 Household Electricity
This section provides an overview of the current electricity access and provision situation in Kebri Beyah (i.e. the baseline situation), detailing the processes involved in using the RERT and the recommendations provided by the tool.
3.4.1 Baseline Situation
Currently Kebri Beyah has relatively good electricity access, with 80% of households connected via wired networks. Primarily, power is provided via national grid connections via host community households or by diesel generators run by private operators. Of the 20% without a wired connection, 28% of households have some form of dry cell battery storage, and 33% have solar lanterns. Candles and solar home systems (SHS) were not evident in the camps, with the lack of spares and repairs for SHS and high initial costs attributed for the lack of SHS uptake.
On average, households receive 5 – 8 hours of grid electricity in Kebri Beyah, primarily in the evening and night hours. Electricity is delivered via informal connections to host households for a monthly flat fee. Diesel-source energy is charged at ~30 ETB per bulb and 90 – 100 ETB per larger appliance (e.g. televisions). Households were found to have 3 bulbs and one larger appliance on average – an average of ~200 ETB / week. Grid and private generation are not reliable in Kebri Beyah, therefore the average hours of electricity does not reflect levels of system breakdown / grid failure in the camp, which can be regular and occasionally long-term.
Dominant camp resident aspirations were to have access to or be able to afford enough electricity to routinely use entertainment (e.g. speakers, tv) or a mixer grinder in their kitchen. Furthermore, consistent and reliable phone charging and access to in-home sockets were seen as priorities by camp residents. Charging costs for residents can be between 3 – 10 ETB for mobile phones and up to 20 ETB for larger appliances (e.g. laptops).
Based on the above data, the scenario data set out in table 3 was defined, including achievable initial investment costs but focusing particularly on lowering electricity costs and improving reliability and affordability for camp households.
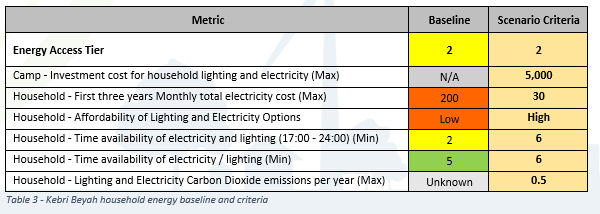
3.4.2 Household Recommendations
Based on the previous criteria, the RERT recommends implementation of centralised wind or a combination of wind / solar PV alongside lithium-ion batteries. These are high cost interventions, selected due the fact that any system implemented in Kebri Beyah would be competing with an established diesel and national grid supplied electricity system. The RERT does not account for the quality of supply from generation sources, using average hours/day and hours/evening to calculate appropriate interventions.
Whilst high cost, the recommended interventions achieve several goals, including greater available energy and negligible CO2 emissions. All of these systems could be implemented in a way which reaches those without current wired electricity sources, as well as providing marked improvements in safety (in comparison to informal host household connections which often lack any wiring protection or switches), lowering costs (in comparison to current tariffs for grid and / or diesel electricity purchase) and providing more robust energy service provision.
Affordability is very low across the board for household electricity solutions, due to the high initial cost of both centralised and decentralised options, although camp supported, or subsidised, electricity provision could bring costs in line with household incomes.
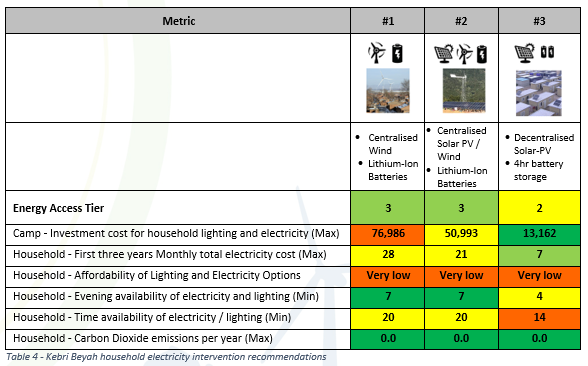
3.5 Central Camp Electricity
3.5.1 Baseline Situation
Camp facilities, including the camp administration offices, accommodation buildings (2), health centre (1) and school buildings (2), are powered by a mixture of regional grid electricity (when available) and diesel generators (including camp authority run and private run generators). At present 3 diesel generators provide electricity to camp buildings, totalling 34 kW of capacity.
With sufficient energy access, the focus of this section is to define interventions which meet wider criteria than improvements in energy access alone. This includes lower running costs, CO2 emissions reductions and system robustness (e.g. backup solutions). To this end, scenario criteria were set to ensure affordable running costs and emissions reductions, whilst not limiting costs.
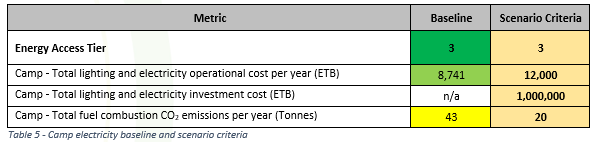
3.5.2 Camp Recommendations
The recommendations provided all centre on low carbon solutions, including 100% solar, 100% wind and multi-technology solutions. All recommendations included battery backup systems due to the intermittent grid issues at Kebri Beyah camp. All recommendations show a complete reduction in fuel emissions, though it is worth noting that any intervention would have a carbon cost associated to the procurement and deployment of new technologies.
The major defining factor across the recommendations is cost. Solar PV is both the cheapest option and has the lowest operational cost per year. This reflects similar projects in the humanitarian sector, where solar PV is preferred for refugee camp situations. The addition of wind energy generation would provide some robustness to the energy system when solar irradiation is low, although an element of backup is already included for these situations through energy storage. Wind is significantly more expensive and increases operational costs, reducing its viability in this scenario.
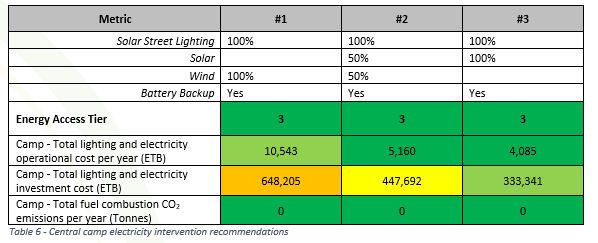
3.6 Use Case Conclusions
The below section compares the recommendations and outputs of the RERT, as detailed in the previous section, against energy interventions recommended by Mercy Corp consultants through engagement and surveying with camp residents and authorities at Kebri Beyah. The purpose of this section is to detail the commonalities and differences between each approach, demonstrating the effectiveness of the RERT and providing a platform for future changes and improvements to the tool.
3.6.1 Comparative assessment
Table 7 sets out the recommendations as set out in the RERT and by the in-camp assessment. A discussion of the recommendations is provided below.
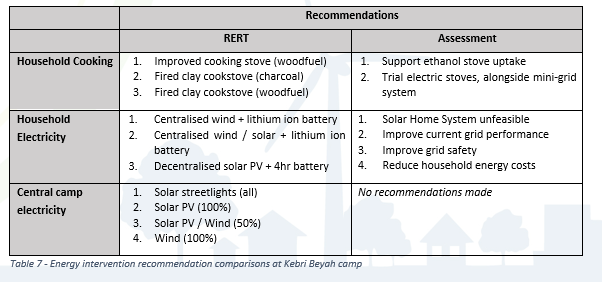
3.6.2 Household Cooking
The RERT defined solutions which are feasible and provide energy access improvements in Kebri Beyah, although there is a lack of ambition in comparison to the in-camp assessment. The key reason for this is that the tool was instructed to target energy tier 2 (a significant jump from the original 0.5) and to make stoves affordable to households. The RERT did not consider electricity access for electric stoves, which greatly increases the feasibility of such solutions.
The in-camp assessment suggests that the biggest barriers to uptake are not technical or even purely financial, although costs of stoves and fuel are big pressures on camp households. The building of awareness of modern cooking solutions was defined as a key barrier, as well as the creation of stronger supply chains for alternative fuels (e.g. ethanol). The main recommendation of the assessment was to conduct a pilot trial with 50 households using electric stoves alongside a microgrid system, as defined in the following household electricity assessment.
In this case, the social drivers, supply chain considerations and synergies between projects (i.e. microgrid -> electric stoves) are not calculated in the RERT, leading to differing recommendations. The RERT interventions are reasonable high-level assumptions but the on-the-ground picture is more complex, with opportunities to define more ambitious projects and more robust local energy systems.
3.6.3 Household Electricity
In line with recommendations from the in-country assessment, the RERT does not recommend use of smaller decentralised solutions, such as solar home systems. These systems were deemed unaffordable to most camp residents and a poor alternative to the current level of energy access (tier 2) from grid electricity and diesel generation.
The RERT recommends suitable solutions for the context, where grid connectivity is high but system robustness and performance are poor. Solar PV and / or wind capacity with lithium-ion storage would be feasible in a centralised manner but would require improvement and upgrades to the current grid infrastructure. Due to the high costs of the deployment, it is uncertain whether the recommended intervention could cost compete with the current grid / diesel generation mix. In all likelihood, central funding with subsidised tariffing would be necessary to implement such ambitious systems.
The in-country assessment does not provide exact recommendations on the best approach to improving household electricity access, focusing more on the barriers to deployment of specific technologies. The critical issues highlighted include household energy cost, system performance and safety. Whilst the RERT recommendations proposed would address cost and performance, these are not functions within the model. Improvements to how costs are dealt with (e.g. suggested tariffing levels / household costs), performance (e.g. number of households reached, backup capacity or time) and safety (e.g. cost of wiring, lighting and socket upgrades) would improve the specificity and applicability of tool outputs.
3.6.4 Central Camp Electricity
The in-camp assessment does not include an assessment of central camp buildings, focusing only on household energy. With a highly connected electricity system in Kebri Beyah, it seems likely that all camp buildings would have sufficient access to electricity, though limited by system performance. The RERT recommendations are suitable low carbon solutions but are relatively high cost. This means they are unlikely to be cost-effective when considering camp buildings alone. It is likely that a system deployed at Kebri Beyah would include provision of energy to households, businesses and central camp buildings.
There are no solar streetlights currently operating at Kebri Beyah. This would be a low cost, low carbon intervention but would require cost comparison against utilising the existing grid to power streetlights. One possible improvement to the RERT tool in this assessment would be to include a breakdown of potential societal benefits (e.g. safety, later working hours, community spirit/cohesion) which may be influenced by solar street lights and improved electricity availability at key camp locations.
3.7 Appendix A – Data Inputs